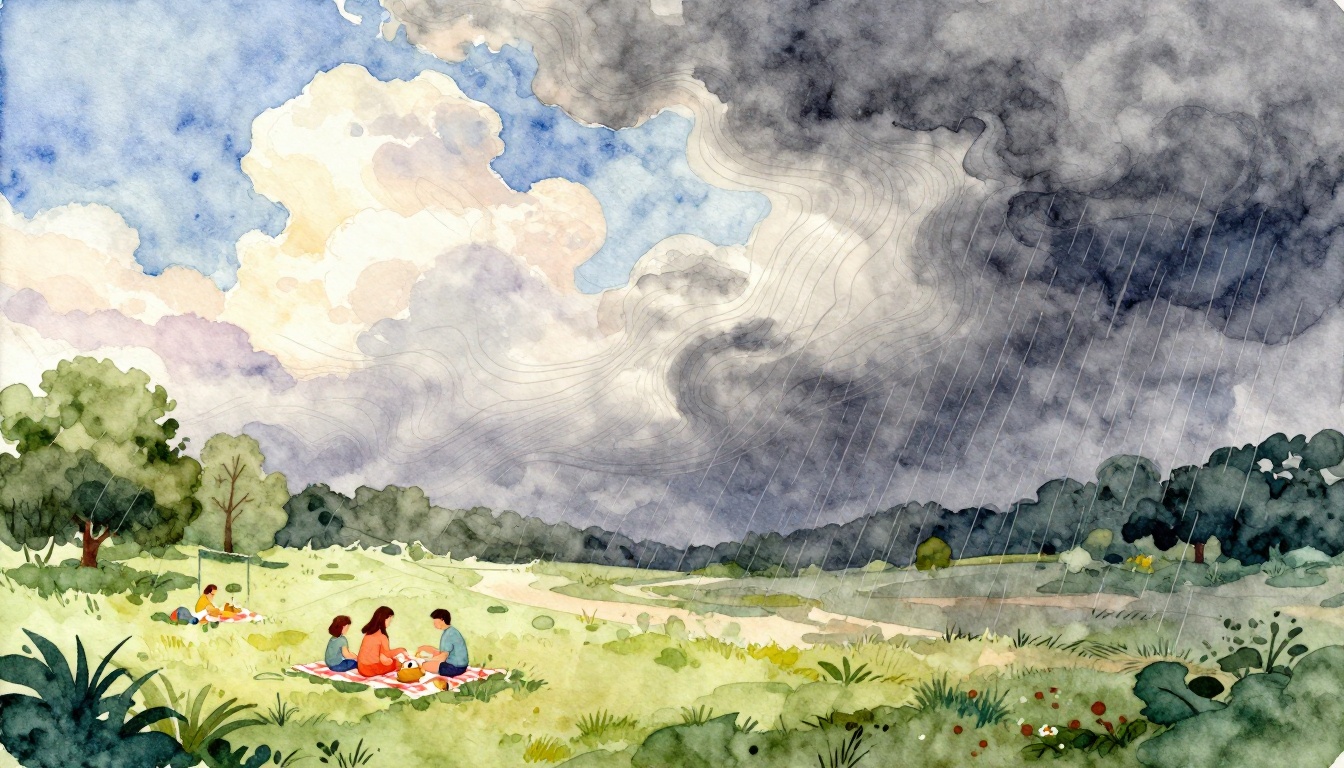
You check the app for a sunny picnic day. Then, just like that, rain shows up anyway. It feels personal, but it’s not. Weather forecasting is a tough job, and even today it has limits.
Modern forecasts are often strong for the near future. In the US, a 5-day forecast is about 90% right, and a 7-day forecast is about 80% right. After that, accuracy drops fast because the atmosphere gets harder to predict.
So why do forecasts fail when you need them most? The short answer is chaos, missing observations, and model trade-offs, plus a human layer that can still make mistakes. In March 2026, the tools are better than ever, but the basics still explain most “how did they miss that?” moments.
How Chaos Theory Makes Weather Wildly Unpredictable
Weather doesn’t behave like a simple switch. It behaves like a living system, with many parts working at once. Temperature, wind, moisture, and air pressure all interact. Small changes can grow into big outcomes, especially over time.
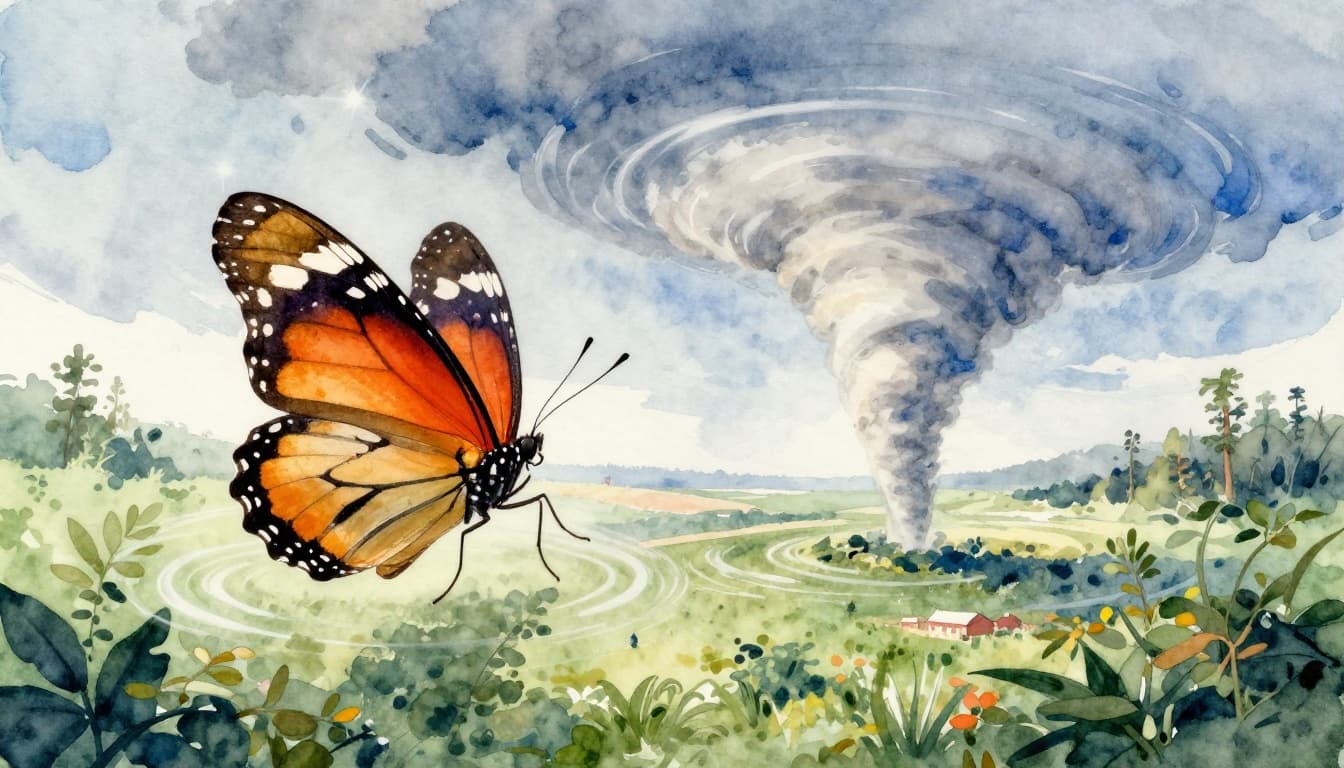
This is the heart of chaos theory (often linked to the “butterfly effect”). A tiny difference in the air today can amplify and shift storms tomorrow. You don’t need a math class to feel it. Think about how a slight nudge can steer a ball. Now imagine the ball is rolling on a surface that keeps changing.
In forecasting, that means the atmosphere’s starting conditions matter a lot. If the “today” snapshot is slightly off, the “tomorrow” result can drift. That’s why forecasts tend to be best close to the present and weaker farther out. As NOAA and others explain, even slight unknowns in wind speed or humidity can cause large differences in later patterns, which is exactly what the butterfly effect describes in weather terms.
For a clear background on the butterfly effect and forecasts, see what the butterfly effect means for weather forecasts.
The Famous Butterfly Effect in Action
The classic story goes like this: a flap of a butterfly’s wings somewhere could contribute to a storm somewhere else. That’s the metaphor. In real forecasts, the details look different, but the logic is the same.
Models track large-scale patterns well. They can follow major fronts and big weather bands. However, they can miss tiny shifts that grow over time. A small wind change can alter cloud growth. That can change rain timing. Then the whole storm structure can shift.
This is also why forecasts usually get framed as “ranges” and probabilities, not perfect certainties. Instead of saying, “It will rain at 3:00 PM,” forecasters often communicate odds, because the atmosphere has too many ways to evolve.
That’s also why most forecasting skill fades around the two-week mark. After that, you still get broad guidance, like seasonal tendencies or general storm tracks. But the day-to-day details become more guesswork than prediction.
Why Forecasts Fade After a Week
Here’s the part that surprises people: the drop isn’t instant. It’s gradual, then steep. Short-term forecasts are more likely to match reality because there’s less time for small errors to grow.
Recent guidance used in US forecasting talks about skill dropping like this:
- 1 to 3 days: usually very reliable for temperature and many rainfall patterns
- 4 to 7 days: often still strong for overall conditions
- 8 to 10 days: usefulness drops, especially for exact timing and location
- beyond 10 days: accuracy can land around 50% or less for many details
So what should you do with that? Use probabilities as your friend. If an app shows a 30% chance of rain, it doesn’t mean “30% of the sky.” It usually means odds based on past similar setups. In plain terms, that amount can translate to “rain happens in a similar pattern about 3 out of 10 times.”
Instead of trusting one number, focus on the forecast trend. If the chance rises across updates, that’s meaningful.
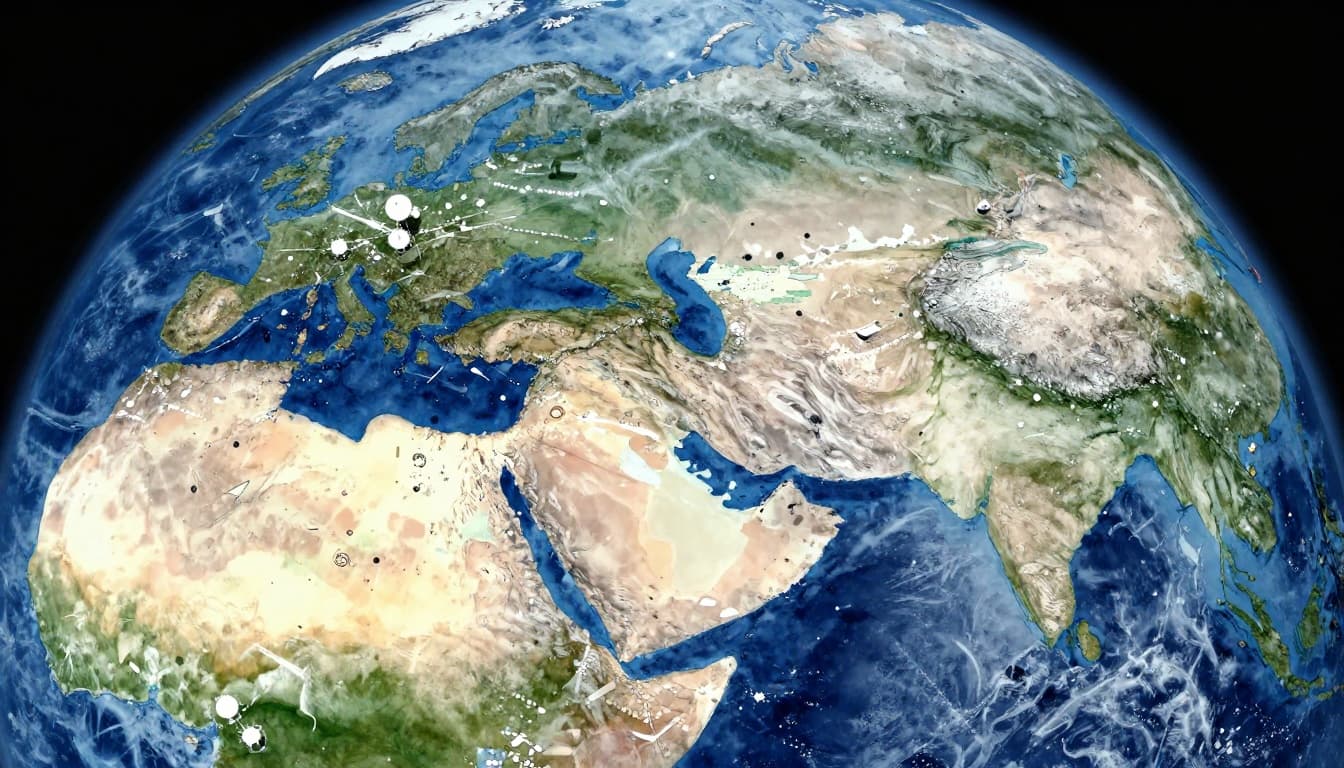
Gaps in Our Global Weather Watch
Even with satellites, radars, and weather stations, we don’t “see” every part of the atmosphere perfectly. Weather forecasts rely on observations to set the initial conditions for models. If the data is missing or delayed, forecasts can wobble.
Some gaps are geographic. Others are temporal. The ocean, for example, covers huge areas with fewer observing sites than cities. Mountains can block signals and hide local moisture and wind patterns. Rural regions also tend to have fewer surface sensors than metro areas.
Global weather services say this problem is real. Weather forecasts depend on constant observations, yet there are large gaps in where data comes from. The World Meteorological Organization has discussed how non-operational or inconsistent stations in some regions reduce forecast accuracy, not just locally but globally too. If you want a direct look at that challenge, read closing the gap in observations.
Blind Spots Over Oceans and Remote Lands
If you live far from a major city, you’ve felt this. Forecasts can seem “close enough” until a storm pops up nearby. Then your backyard gets the rain, while your area forecast said otherwise.
Oceans are the biggest reason this happens. Land-based stations can’t sample the marine boundary layer the same way. Also, storms can strengthen or drift differently over water than models expect.
Remote land adds its own problems. Sensors might be sparse, or data might arrive less often. As a result, models sometimes start with a less accurate picture of moisture and winds.
For example, researchers work on improving ocean estimates for exactly this reason. One recent study on ocean reanalyses in sparse observational regions looks at how transfer learning can help reconstruct realistic physical behavior when direct measurements are limited. See improving ocean reanalyses with sparse data.
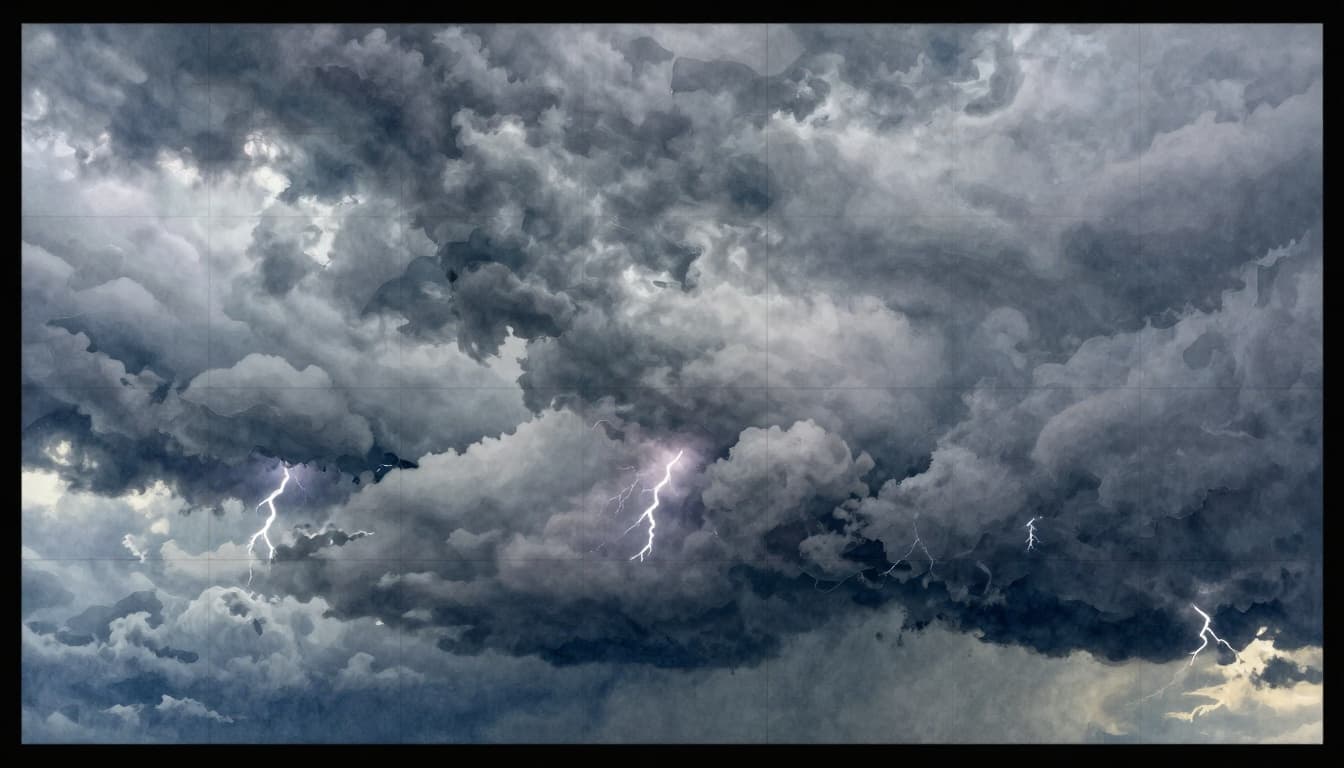
Nighttime Storms and Urban Twists That Sneak By
Night is harder to forecast than many people expect. Some conditions shift after dark, like cooling at the surface and changes in boundary-layer stability. Also, certain storm types prefer the evening hours, then fade fast before forecasts catch up.
Cities also create their own weather quirks. Heat islands can nudge the air to rise in ways that rural areas don’t. Coastal areas add sea-breeze effects that can be tricky to time. Then add terrain and you get local wind patterns that don’t always match a broad forecast.
Radar helps, but radar has limits too. If storms form in the gaps between radar coverage or start very weak, they might not show clearly right away. So a “nothing happening” forecast can turn into “why is there lightning at my address?” later.
Why Computer Models Can’t Nail Every Detail
Forecasts come from computer models. They simulate the atmosphere using physics and math. However, the model is not the real world. It’s a simplified version, built for speed.
A key idea is grid spacing. The model breaks the atmosphere into boxes (cells). Each cell gets values like temperature and humidity. The model then “evolves” those values forward in time.
But what if a storm’s strongest rain band is smaller than the grid box? Then the model can smear it out. What if a local valley wind accelerates in a way the grid can’t represent? Then the model can get the timing wrong.
For deeper context on how different forecasting models work and why they differ, see the difference between Euro and GFS models.
Grid Sizes That Skip the Small Stuff
Imagine weather like pixels on a screen. If your screen has big pixels, you lose tiny details. Weather models work like that, too.
Even the best models often struggle with fine-scale events, like small thunderstorms, narrow wind shifts, or quick coastal changes. These can matter a lot for everyday plans: a five-minute difference can decide whether your yard gets soaked.
That’s why forecasts sometimes get “directionally right” but “locationally wrong.” The system looks right on a map. Then your exact block misses by a few miles.
When Models Clash and Computers Run Short
Different models can also disagree. They may use different physics assumptions, and they may handle clouds, precipitation, and land surfaces in different ways. Also, each model needs computing time. More detail requires more power.
That is where ensembles come in. Instead of running one “best guess,” an ensemble runs many slightly different versions. Each run starts from slightly different initial conditions. Then you look at the spread and odds.
This matters because it turns chaos into probability you can use. If most ensemble runs bring storms to your county, the forecast confidence is higher. If outcomes split widely, the forecast becomes less certain.
Meanwhile, grid and compute limits still matter. Supercomputers are powerful, but they’re not infinite. So forecasting is a balancing act: speed, resolution, and accuracy.
Human Forecasters Adding Their Own Spin
Even with strong models, humans still play a role. Forecasters choose which guidance to trust, how to blend model runs, and how to communicate uncertainty. They also watch for known model issues.
Sometimes human judgment helps a lot. Other times it adds another source of error. For example, if models consistently struggle with a certain storm track in your region, forecasters might adjust based on experience. That can improve results. It can also create bias if the setup is unusual.
A good explanation of why forecasts can seem wrong, from a real meteorologist perspective, is in why weather forecasters often get it wrong.
So the key takeaway is simple: forecasts are not just “computer outputs.” They’re interpreted predictions. Interpretation can be smart. It can still be wrong.
Fresh Advances Sharpening Tomorrow’s Forecasts
In March 2026, forecasts are better than they were a decade ago. AI now helps spot storm patterns earlier, and satellites provide more frequent updates. Also, models increasingly blend physics-based methods with machine learning tools.
The goal is not just more accuracy. The goal is faster updates, better radar interpretation, and better uncertainty estimates. That matters for warnings and planning.

AI and Smarter Satellites Stepping Up
AI is especially useful for pattern recognition. It can help with short-term forecasting, like pinpointing where rain bands are likely to form next. Satellites feed those systems with constant, wide-area views.
New satellite efforts also aim to improve coverage. For example, Tomorrow.io has raised funding to launch next-generation weather-monitoring satellites focused on watching storm clouds as they develop. If you want one example of that push, see Tomorrow.io’s next-gen satellite plans.
Physics-based models still matter, because the atmosphere obeys rules. AI can help with speed and pattern spotting, but it’s not magic. Chaos still limits long-range detail.
Tackling New Challenges Like Warmer Hurricanes
Warmer ocean and air temperatures can change storm behavior. Hurricane intensity can shift fast, and that makes exact forecasts difficult. Even when track forecasts improve, the intensity part can lag, because it depends on small-to-medium environmental details.
However, it’s not all harder. Some storm types become easier when models get better at certain dynamics, or when improved data helps. Also, “slightly better odds” still saves lives. Warnings don’t need perfection to be useful. They need enough lead time and enough accuracy to drive safe choices.
The atmosphere will always be chaotic. But today’s systems can handle that chaos better than older setups. They do it with better observation, faster compute, and smarter uncertainty reporting.
Conclusion
Weather forecasts are sometimes wrong because the atmosphere is chaotic, not clockwork. They also rely on data we do not fully capture, especially over remote areas and at night. On top of that, models simplify reality into grids, and computers must make trade-offs.
The good news is that forecasts keep improving in 2026. The biggest upgrade is how well modern systems estimate uncertainty. So instead of treating a forecast like a guarantee, treat it like a guide.
When you check the app next time, look at the trend and the probabilities, not just the headline. What was the last forecast miss that surprised you, and what would you do differently now?