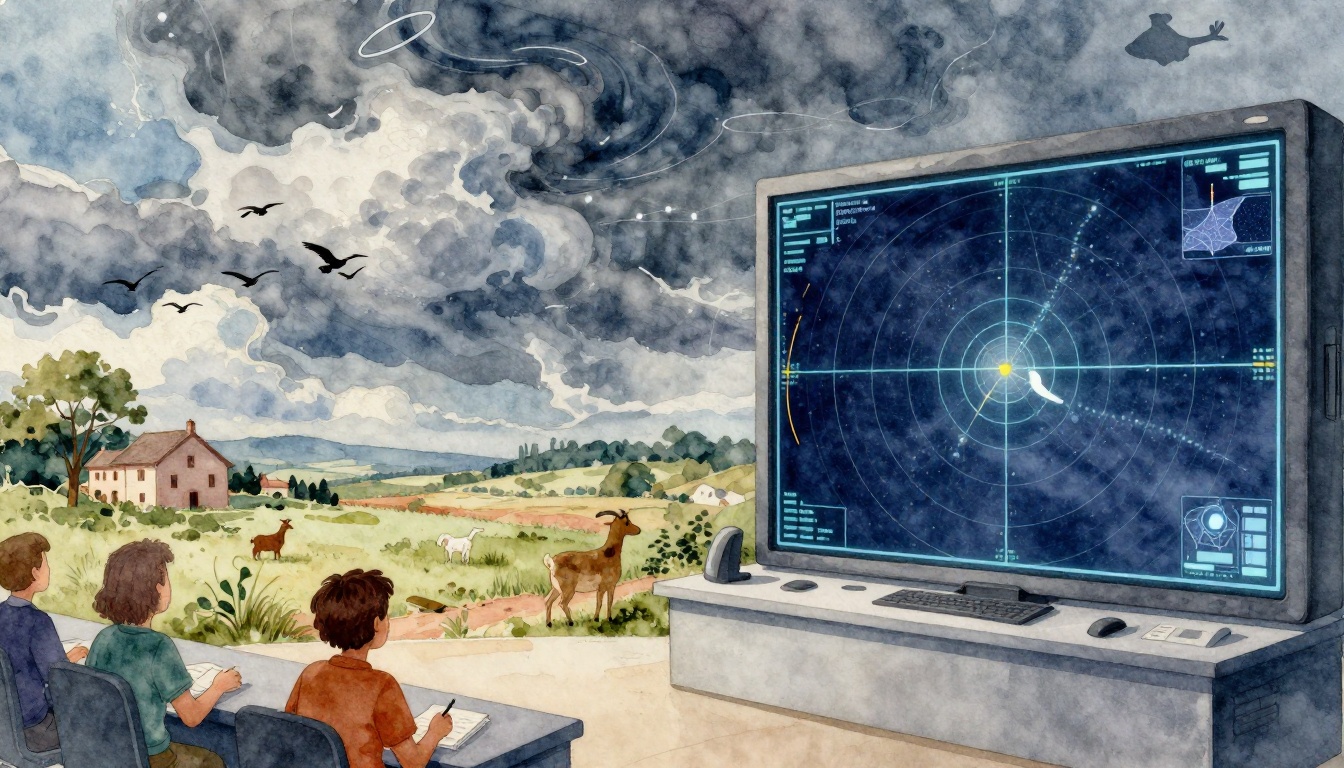
A lot of people once watched clouds and animal behavior to guess rain, because an unexpected storm could wreck a day (or worse). Today, you can get weather forecasting improvements over time alerts that tell you when to seek shelter, even before the first drops fall. As a result, forecasting has moved from gut feeling to fast, data-heavy guidance you can act on.
That shift is huge, including in recent AI work. Even though named hurricane examples from early 2026 aren’t widely published yet, recent AI trials have shown forecasters get sharper storm paths and strength signals days earlier than older methods, with models like DeepMind’s GraphCast previously calling Hurricane Lee’s landfall about 9 days ahead.
Next, let’s go back to the first methods people used to read the sky and track storms.
Ancient Times to the 1800s: Watching Nature’s Signs
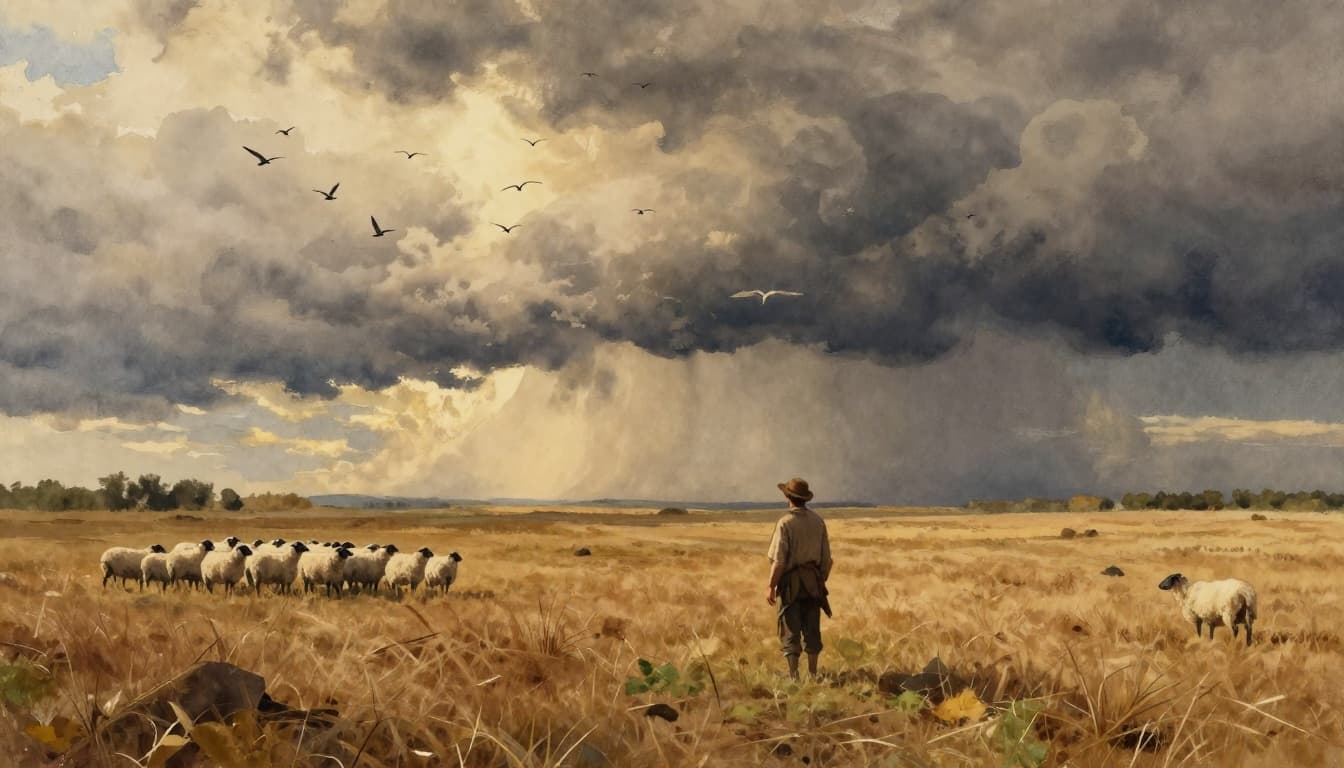
Long before anyone predicted tomorrow’s rain, people tried to read weather like it was a story unfolding in the sky. That history of weather forecasting starts with farmers and sailors who watched clouds, winds, stars, and animals, then made their best guess. Their methods were simple, local, and often right, but the margin for error could be brutal.
Over time, new tools and faster message systems helped those guesses turn into something more dependable. You can even see a pattern: as information traveled farther and faster, forecasts improved. The move from “watch and hope” to “measure and plan” didn’t happen overnight, but the groundwork formed early.
How stars, winds, clouds, and animals guided everyday decisions
For farming, weather wasn’t just discomfort. It decided harvest size, planting timing, and livestock health. So people built rules from repeated observations. A change in wind could mean dry days or faster storms. Cloud shape could hint at rain or a passing shower.
Animals also acted like living weather gauges. Birds often change how they fly before storms, and some farmers learned to trust those patterns. Meanwhile, sailors watched sea swells and sky glow because water reacts early to wind shifts. If you’ve ever seen a kettle start to rattle before it whistles, you get the idea. The signs came first, then conditions followed.
Ancient writers recorded these ideas too. Greek thinkers like Aristotle discussed rain and winds, while other cultures studied cloud halos, moon effects, and seasonal patterns. In short, people treated the weather as something you could interpret, not just something that happened to you.
Early “forecasts” were mostly local and short-range
Even when the signs were correct, the window was small. Most predictions covered the next day, sometimes less. That’s because the sky you watch today tells you what’s near you, not what’s brewing 300 miles away.
So accuracy stayed limited. A farmer might get a warning, but it might arrive after the real danger had passed. A ship could avoid one storm only to meet another. Without fast communication, forecasters couldn’t compare observations across regions.
Here’s why that mattered: storms do not respect town lines. They move, grow, and bend with the atmosphere. With only local clues, you could spot a threat, but you often couldn’t track it far enough to plan routes or timing with confidence.
In other words, early methods helped people prepare, yet they still faced the same basic problem. No wide view, no reliable tracking.
Thermometers and barometers made observations more than guesses
The next leap came when people stopped relying only on signs and started measuring. In the 1600s, the barometer emerged, letting observers connect storm risk to air pressure changes. Later, in the 1700s, the mercury thermometer gave a steadier way to track temperature instead of judging it by feel.
These instruments changed the history of weather forecasting because they reduced guesswork. Two observers could look at the same readings and compare notes. That made prediction feel less like luck and more like evidence.
Still, there was a catch. Measurement alone didn’t solve the speed problem. Data had to travel, and back then it moved at the pace of people and ships. Even with new tools, information might only travel about 40 to 100 miles per day by horse or sailing ship. So forecasters still worked with short-term, regional snapshots.
That’s where the 1800s began to pull away from the past. Faster communication created a bigger picture, and a bigger picture created better forecasts. And that shift starts with a technology you can almost hear clicking into place, the telegraph. {“function_call”:”generateImage”,”arguments”:{“sectionTitle”:”Post-WWII Computer Breakthroughs Kick Off Reliable Forecasts”,”imageIntent”:”Show the early computer-driven shift in weather forecasting using 1950s-era equipment and scientists at work.”,”prompt”:”A 1950s research room with early electronic computer consoles, scientists reviewing weather charts on a desk, muted lab lighting, watercolor style with soft blending and visible brush texture, no readable text, no logos”,”style”:”watercolor style with soft blending and visible brush texture”} }## 1900s Dawn: Math, Planes, and Dreamy Predictions
Weather forecasting didn’t jump forward all at once. Instead, it moved in steps, each one shrinking the gap between what the sky was doing and what we could predict. By the time the mid-1900s arrived, forecasters had better data, better physics, and finally the computer muscle to turn equations into usable forecasts.
Post-WWII Computer Breakthroughs Kick Off Reliable Forecasts
After World War II, the key change was simple to say and hard to build: computers could crunch the same air-physics math that scientists wrote on paper. That mattered because weather isn’t just a “today” problem. It’s a chain reaction across time and space, so forecasts need fast, repeated calculations.
In 1954, Jule Charney and John von Neumann helped prove that idea could work in practice. They built an early computer model of weather on the IBM 701, using the new wave of numerical weather prediction concepts. At the time, this wasn’t a neat demonstration. It was closer to a first hard run on muddy ground, where every hour of compute time counted.
What supported those early runs? Data that felt more like signals than guesses. For example, radar systems like the AN/CPS-9 helped track storm structure sooner. In the early 1950s, forecasters also used developing techniques to issue tornado forecasts in 1952, which pushed weather warning thinking from “notice the storm” toward “detect the setup.”
Meanwhile, aviation and upper-air observing had already started filling in the vertical picture. Even so, weather forecasting still suffered from a limited view, because you cannot predict what you cannot observe. That’s where satellites arrived like a new set of eyes.
Then, in 1960, TIROS-1 gave meteorologists a global look from above, with images that helped show cloud patterns and weather systems at a scale humans could not measure quickly. You can see how TIROS-1 marked the start of routine space-based weather monitoring in NESDIS’s history of TIROS-1.
By 1966, the gap narrowed further. Computers could produce forecasts that matched human skill for key targets like sea-level pressure and storm behavior, especially when running larger models with more layers. In plain terms, the machines had caught up enough to run the full logic of the atmosphere, not just simplified versions.
That’s the turning point behind today’s speed and accuracy. Once large systems worked reliably, forecasting stopped being a daily gamble. It became a repeatable process you could trust. And that trust grew quickly, because the inputs kept getting better too, feeding the next round of faster calculations.
Radars, Satellites, and Networks Make Warnings Faster in Late 1900s
By the late 1900s, weather warnings got faster because the warning process stopped waiting on a single data source. Instead, it blended observations from above, from the ground, and from the sea, then pushed results to forecasters quickly. Think of it like getting a full recipe, not just smelling dinner from the hallway.
From Sparse Data to Global Coverage
Early forecasting struggled with a simple problem: the atmosphere stretches far beyond any one town. When observations were rare, forecasters had to guess what the weather was doing between measuring points. Networks fixed that gap, both vertically (from the surface up through the sky) and horizontally (across regions and oceans).
A big vertical boost came from upper-air observing, especially radiosondes. These small instruments launch on a schedule and climb as they measure air temperature, humidity, and wind at different heights. Even when the surface looks calm, the sky above might already show a storm setup. Radiosondes filled that vertical picture so models and forecasters could see where energy and moisture were building.
At the surface, the U.S. also moved toward more consistent station coverage. In the 1990s, programs like ASOS helped by automating observations at many airport and nearby sites. ASOS runs around the clock and reports steady measurements that support faster detection of changes in wind, pressure, and temperature. You can see the scale of that network in NOAA data on Automated Surface/Weather Observing Systems (ASOS/AWOS). Those updates mattered because severe storms often begin as small shifts that grow quickly.
Meanwhile, the ocean and coastal zones needed their own kind of coverage. That’s where buoys and other marine observing platforms helped. They don’t just count waves. They also report sea surface conditions and meteorological variables that improve forecasts over water, which then flow into coastal warning decisions. In other words, a storm warning inland depended on what was happening offshore hours earlier.
Then radar and satellites completed the picture. Radar improved detection of precipitation and storm structure, which is why Doppler radar weather improvements became so important for tornado, hail, and flood alerts. The U.S. modernized its warning radar network in the 1970s and beyond, starting with major upgrades such as the WSR-74 era and the push toward Doppler testing. Later, those advances fed into the NEXRAD network that could better identify storm motion and rotation.
Satellites also changed the game for global coverage. By the late 1900s, weather satellites increasingly replaced older ship-based observation methods over the ocean. They provided frequent views of cloud systems, storm organization, and movement across regions that ships could not cover fast enough. As a result, warnings could start earlier and feel more confident, not just reactive.
All of this added up to a steady trend: data became more continuous, and forecasts turned quicker. NOAA’s broader modernization also supported faster processing and better coordination across the National Weather Service, so alerts could move from radar and satellite detections to public warnings with less delay. If you want the bigger timeline of how these capabilities took shape, see NOAA’s History of the National Weather Service.
The bottom line is this: when observations cover more of the atmosphere, forecasters can spot trouble sooner. That extra time, often by minutes to hours, helps people take shelter before the storm arrives. {“function_call”:”generateImage”,”arguments”:{“sectionTitle”:”Key Players and Tools Driving the AI Boom”,”imageIntent”:”Illustrate multiple AI weather forecasting organizations and compute resources in one cohesive watercolor scene without readable text.”,”prompt”:”A watercolor-style scene showing a NOAA weather center, a server rack, and a scientist reviewing storm tracks under a cloudy sky, blended watercolor textures, soft muted palette, no readable text, no logos, no signs”,”style”:”watercolor style with soft blending and visible brush texture”}}}## 2026’s AI Powerhouse: Smarter, Faster Predictions Than Ever
If you want to understand why AI weather forecasting 2026 feels quicker, look at how the biggest labs fit together. Each player brings a different piece, from NOAA’s operational models to DeepMind’s fast ensembles, Nvidia’s hardware-speed help, and the Met Office’s research work on AI for numerical prediction.
Key Players and Tools Driving the AI Boom
NOAA: AI GFS family for faster global storm skill
NOAA’s biggest leap in operational AI comes from its AI-powered GFS lineup. It’s built to run fast enough for real forecasting cycles, while still improving storm track and timing.
Here’s the clean split:
- AIGFS: a deterministic global forecast that aims to deliver a strong baseline quickly, so forecasters see what’s most likely sooner.
- AIGEFS: an ensemble approach that generates many possible futures, which matters because storms often hinge on small changes.
- Hybrid-GEFS (HGEFS): a super-ensemble that mixes AI members with older GEFS members, so you get the best of both worlds.
NOAA also ties these tools into decision support, so forecasts can support impact planning. You can see this direction in NOAA’s announcement about AI model updates added to DESI: New AI weather forecast models added to DESI.
DeepMind: WeatherNext 2 for rapid multi-outcome hurricane tracking
Google DeepMind’s WeatherNext 2 pushed speed hard, without giving up the ability to test multiple outcomes. Instead of betting on one path, it produces lots of possible evolution patterns. That style fits storms well, because uncertainty is not a bug. It’s the point.
For a real-world example people talked about in late 2025, DeepMind-linked modeling was credited with strong performance during Hurricane Melissa, including signals that supported rapid intensification timing. CNN covered that discussion with a focus on AI forecasting results: AI hurricane forecasts used DeepMind model.
Nvidia: Earth-2 to speed up rain and fine detail
Nvidia’s contribution looks less like a single forecast model and more like a speed engine. Earth-2 open models help push key weather tasks forward on modern compute, which reduces the time gap between “new observations” and “useful local detail.”
In practice, that matters for things like:
- rain nowcasting where local patterns matter most
- faster downscaling from broad fields to neighborhood-level risk
- ensemble generation for “what if” scenarios
Nvidia’s overview of the Earth-2 family is here: NVIDIA Earth-2 family of open models.
Met Office: CASIM and AI support for storm and cloud realism
Across the Atlantic, the Met Office focuses on combining AI with physics-based prediction, especially where clouds and storm structure drive the biggest forecast shifts. Their work on AI for numerical weather prediction looks at ways to keep physical consistency while improving how models represent key processes. For example, their research and AI capability pages explain the ML workstreams they pursue to improve forecast products: Artificial Intelligence for Numerical Weather Prediction.
The bottom line: NOAA brings operational AI ensembles, DeepMind brings fast multi-outcome skill, Nvidia accelerates the compute-heavy parts, and the Met Office strengthens physics plus AI realism. Together, that’s why 2026 forecasts can arrive sooner, stay sharper, and still explain uncertainty in a way forecasters can trust.
Conclusion
Weather forecasting has improved because people kept closing the same gaps, first in observation, then in math, and finally in speed. Early on, forecasts relied on local signs, so storms often surprised communities. Later, telegraph-era updates, computers, radar, and satellites widened the view, so warnings could start sooner. As a result, modern forecasts now reach more places with more consistency, even when weather changes fast.
Today’s strongest leap comes from how today’s systems handle uncertainty. AI models run rapid ensembles, so forecasters see several possible outcomes instead of one guess. At the same time, global networks and faster processing help models update more often, which keeps short-term guidance steadier. The key theme is clear: better data plus faster computation means forecasts spend less time catching up and more time guiding decisions.
Looking ahead, the next gains will likely come from deeper AI training, wider sharing of observations, and sharper focus on extreme events. The sky will still be chaotic, but our tools keep getting better at reading chaos early.
What improvement would you want next, longer lead time, better hourly rain timing, or fewer false alarms? Share your pick in the comments, and subscribe to the newsletter for updates on new forecasting wins.