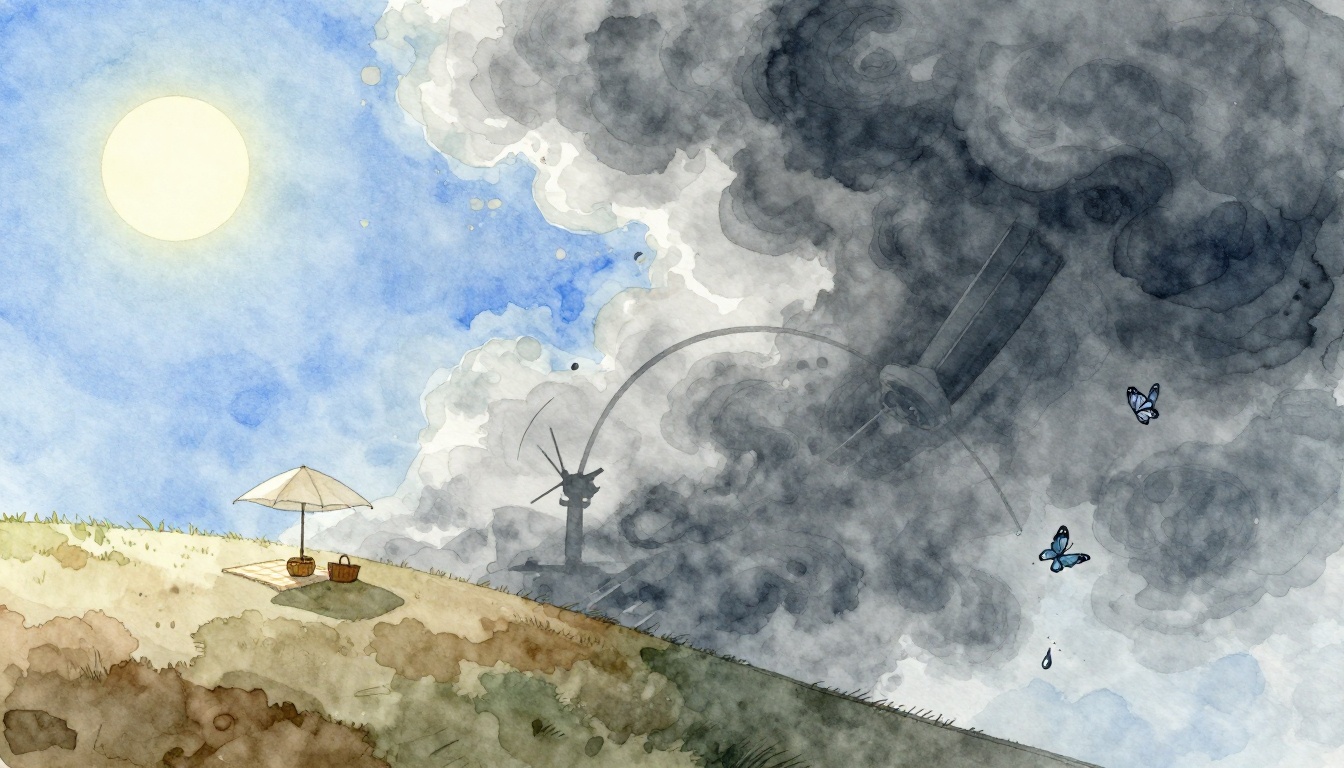
A picnic ruined by surprise rain sticks with you, because the forecast said “no rain.” Weather forecasting matters for daily plans, safety, and big events, yet it still misses sometimes. The main reason is that weather is chaotic, so small changes can snowball into very different outcomes.
Forecasting starts with data from satellites, radar, weather balloons, and ground stations. Then computers run models, and meteorologists review the results, often using many model runs (ensembles) to estimate odds. Even then, forecasts can drift when the atmosphere changes faster than our tools can track.
In 2026, AI and better systems help find patterns faster and improve updates. However, limits remain, especially when observations are missing or storms pop up in tricky ways. Next, you’ll learn how chaos, model shortcuts, data gaps, and human choices each push accuracy down.
The Butterfly Effect: Why Small Changes Create Weather Chaos
Weather can feel personal when it ruins your plans. One minute the sky looks calm, then clouds pile up and rain hits. Still, the real story starts much earlier, with how the atmosphere reacts to tiny differences.
A good way to picture it is a snowball rolling downhill. At first, it picks up only a little snow. Yet as it gathers speed, it grows fast and becomes hard to control. Weather works the same way. Small changes in heat, moisture, and wind can grow until they steer an entire system toward a different outcome.
Real Limits from Math and Nature
Weather mixes several moving parts at once. Warm air, water vapor, clouds, and wind all tug on each other. On top of that, the atmosphere never sits still. Tiny swirls in the air (eddies) form and break apart constantly, even when you cannot see them.
Now add the key problem: our starting measurements never match the real world perfectly. We sample the atmosphere with satellites, radar, buoys, and weather stations. However, those tools still miss some small-scale details. As a result, the models start with slight “wrongness,” even when the forecast team does everything right.
That’s where chaos theory shows up in plain language. Think of the famous butterfly idea. A butterfly flaps its wings somewhere far away, and it nudges air pressure ever so slightly. Most of the time, that nudging alone would not matter. But the atmosphere already contains lots of energy and lots of motion. So, the tiny nudge can grow, because the air flows react to small differences in the inputs.
In math terms, there is a timing limit called Lyapunov time. After about one Lyapunov time, errors typically grow so much that the forecast stops being reliable for the specific details. For Earth’s atmosphere, this often lands near the scale of about two weeks. That lines up with the practical rule many forecasters use: after around 10 days, accuracy begins to fade quickly, and after longer than that, the forecast becomes more of a range than a plan. Even in 2025 and 2026, the “wall” did not vanish. Researchers still describe predictability as something that depends on how errors multiply, not just on faster computers.
So why do short forecasts feel so good? Because the atmosphere has not had enough time to amplify small mistakes. Today and tomorrow, forecasts can often pin down conditions within a useful margin, like temperature trends and wind direction. A week ahead, the atmosphere starts running away from tiny errors. After that, the exact timing of rain, the exact track of a storm, and the exact intensity become guesswork.

In studies of atmospheric predictability, scientists often distinguish between two limits. One is intrinsic, meaning chaos in the system itself. The other is practical, meaning our imperfect observations and model choices. Both matter. Even if you remove some practical issues, the intrinsic part still caps how far out you can forecast exact weather.
For a clear explanation of how these limits affect longer horizons, see how predictability limits relate to the butterfly effect. And for a wider look at why “butterfly effect” ideas spread beyond their simplest version, check National Geographic’s breakdown of the real science.
Computer Models: Powerful but Full of Shortcuts
Weather models act like digital Earth twins. They crunch numbers fast, using physics to move air, moisture, and heat forward in time. Still, they must make trade-offs, so they take shortcuts that work well for big patterns but break down for local surprises.
In particular, models often treat your backyard like it covers a whole block, then the whole block, then the whole county. That averaging matters. It can smooth away the very details that create real weather, like a gust line from a coastline, a lift in a mountain valley, or a pocket of warm air trapped by trees.
So when a forecast says “60% chance of rain,” it’s not guessing randomly. It’s reporting uncertainty after a lot of averaging, smoothing, and limited resolution.
When local terrain hides the data the model needs
Some places fight the forecast from the start. Coasts, mountains, and dense forests can distort winds and rain in ways that a grid-based model struggles to represent.
Along coastlines, ocean breezes and sea spray can change airflow over minutes. In mountains, air gets forced upward, then it cools, then clouds grow fast. Meanwhile, forests can add friction and alter heat transfer, so the air near the ground behaves differently than open fields.
Here are common “hidden data” examples that make forecasts miss local rain:
- Coasts: Sea breeze fronts can stall, surge, or turn. A model may smear that sharp boundary across grid cells.
- Mountain slopes: Orographic lift can boost storms in one valley while nearby peaks stay dry.
- Forest canopies: Shade and moisture keep some areas cooler, which changes how clouds form.
- Cities: Heat islands can trigger lifting and storms where parks and suburbs stay calmer.
If you want a grounded look at why model behavior changes in these settings, see challenges in forecasting local heavy rainfall in mountainous regions. The key point is simple: steep terrain creates small-scale effects that take real data and real resolution to capture.
Why sudden storms pop up when the model “averages” them away
Thunderstorms often form from ingredients that appear in the right place at the right time. The catch is that models do not watch every ingredient at street level.
Think of each model grid cell as a bowl. The model pours in average conditions, like average temperature and average wind, then forecasts from that bowl. But thunderstorms care about sharp edges, like a narrow line of cooler air, or a pocket of moisture that spikes near the ground.
As a result, storms can “pop” when something local develops faster than the model’s smoothing can represent it. For example:
- A breeze from the ocean pushes inland.
- The breeze meets a cooler pocket from a shaded valley.
- Air lifts quickly, moisture condenses, and a storm starts.
- The model may show weaker lift, so it forecasts only scattered showers.
This is why you might see a forecast with low chances, then a wall of rain at 4:15 PM. The model gave you the broad story. Local physics wrote the final scene.
High-resolution models help, but they still have limits. In 2026, top systems like ECMWF IFS and U.S. tools like HRRR can get much closer for short-range forecasts. HRRR supports detailed U.S. nowcasting, while ECMWF remains strong for the first several days. Even so, thunderstorms stay hard because they rely on tiny updrafts and small differences in heat and moisture. A storm can be born in one grid cell and miss the next.
You can see how forecasters clash with microclimates in real life in meteorologists vs. microclimates in Southeast Alaska. Places like that show how quickly weather changes when terrain and exposure steer storms.
How “probability of rain” becomes a realistic expectation
When forecasts miss exact timing, they often compensate by reporting chances. That’s what ensemble forecasting is for. Instead of trusting one run, forecasters run the model multiple ways, then compare outcomes.
After that, a probability like 60% rain means many plausible runs produce rain somewhere in the forecast area. It does not mean rain will fall for everyone, at the same minute, with the same intensity.
Here’s the practical way to read it:
| Forecast wording | What the model is really telling you |
|---|---|
| Chance of rain | Many ensemble runs suggest rain likelihood, but placement and timing vary. |
| Higher QPF (more liquid equivalent) | More runs build stronger moisture and lifting, so totals trend up. |
| Thunderstorm wording | Conditions exist for storm growth, but exact cell location still has uncertainty. |
| Short forecast window | More time means fewer amplifying errors, so local details hold better. |
In short, computer models are powerful, but they use shortcuts that blur the fine print. Terrain, forests, coasts, and cities add extra sharpness that can vanish in averaging. Until you get observations at the right scale, the forecast can only give you the odds, not the certainty.
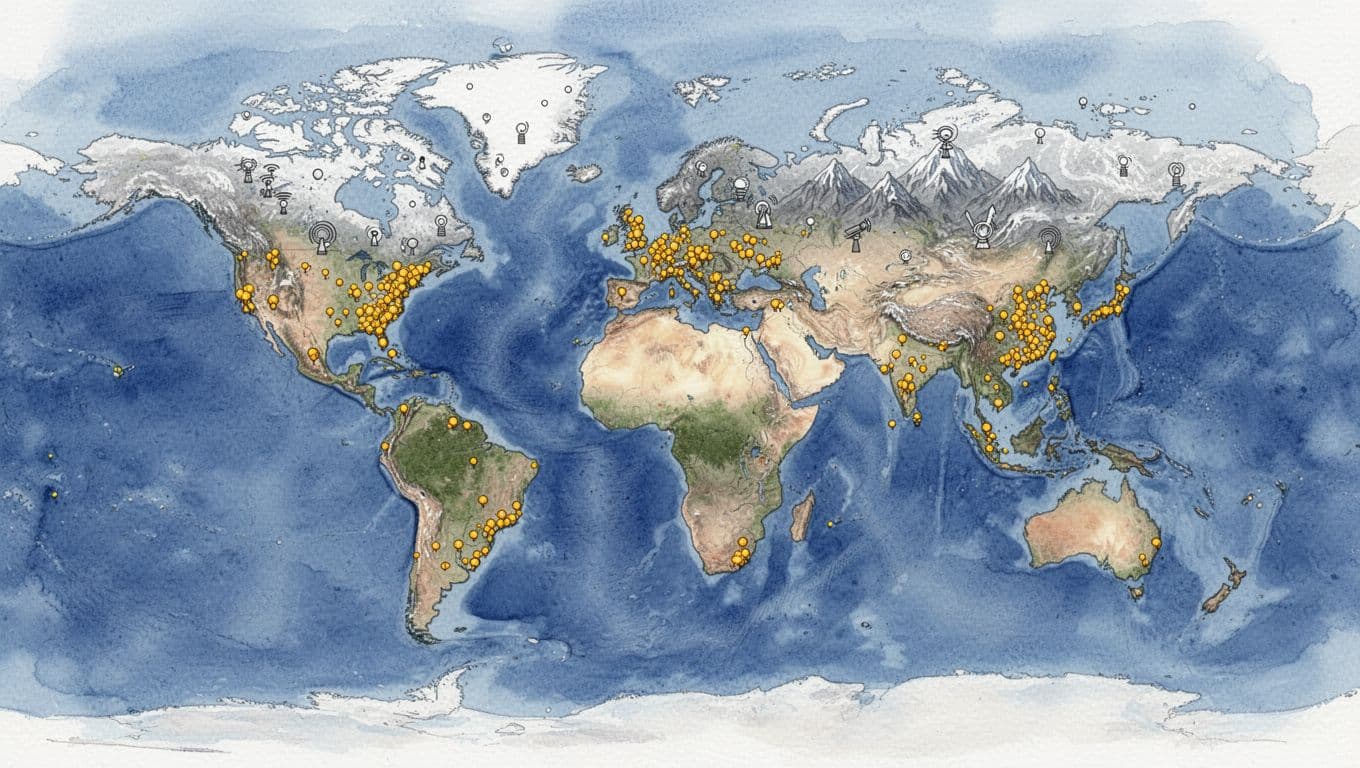
Data Gaps: Blind Spots in Our Weather Watch
Forecasting depends on a simple idea, we need good starting data. Yet the planet is not evenly measured. When parts of the world act like invisible corners, models lose detail, and uncertainty grows.
In other words, weather prediction can be accurate in places and shaky in others, even if the people running the forecast do everything right.
Why Oceans and Mountains Stay Mysterious
Oceans cover most of Earth, and that alone creates blind spots. Satellites see clouds and surface patterns, but oceans still hide key details. For example, they can miss the exact mix of wind speed and moisture just above the surface. Waves also roughen the air, and that small-scale turbulence matters when storms grow.
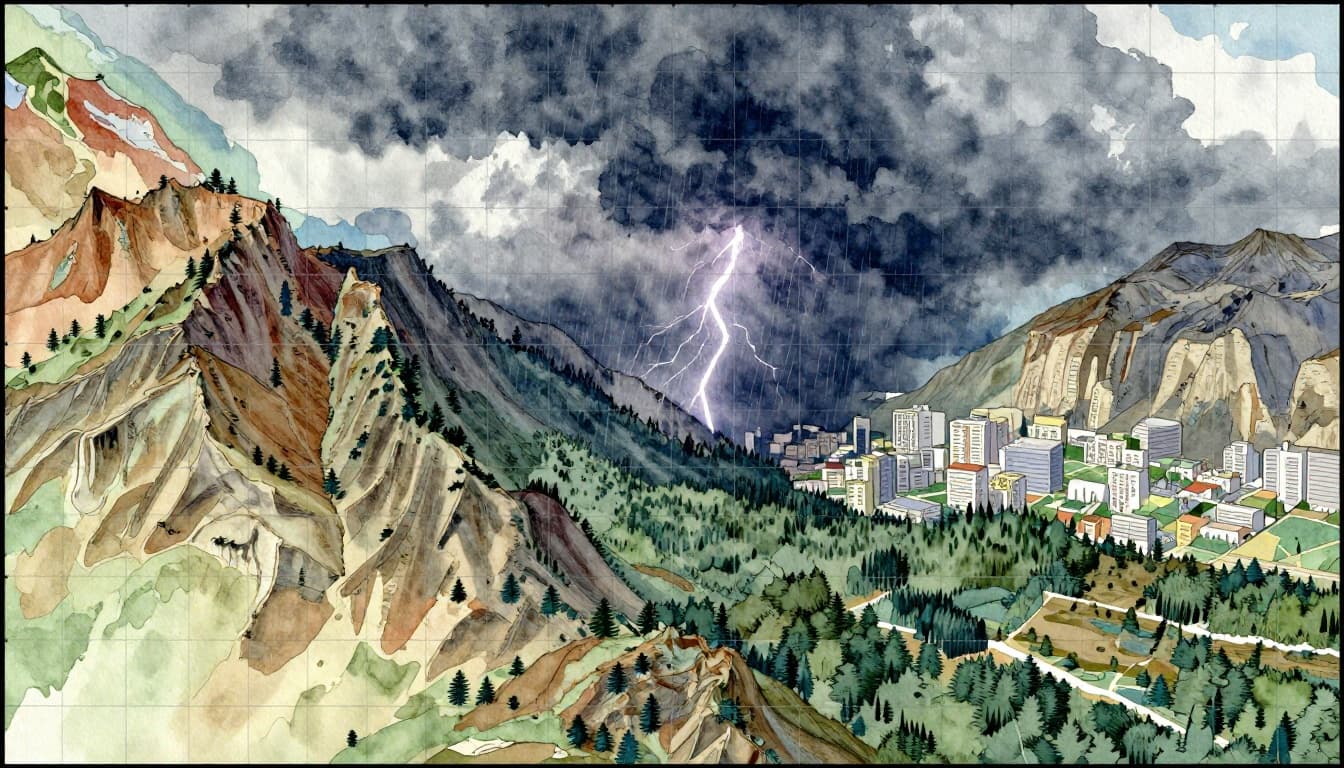
Mountains add a second kind of mystery. They block signals and distort airflow fast. When wind hits a ridge, it can force air upward, then dry it out, then reload it on the next slope. These changes can happen within a short drive, and a forecast grid may smooth them away.
Coastal areas feel that mismatch most. Sea breezes shift rapidly, and mountain valleys can steer them like a funnel. So, one coast forecast might wobble because the model has only part of the story. It guesses how the boundary between ocean air and land air evolves, and it often gets the timing slightly off.
Now connect that to the “starting data” problem. If the model begins with a slightly wrong wind field over the ocean or in a mountain gap, chaos can magnify it. That means a forecast can start near the right answer, then drift away as the storm system moves.
In practice, data-sparse regions often need extra surface observations to close the gap. The European Centre for Medium-Range Weather Forecasts explains why this matters, especially where observations are thin or inconsistent, in the importance of additional surface-based observations in data-sparse regions.
- Oceans: fewer in-water sensors and fewer reliable surface measurements in storms
- Mountains: sharp lift and rain gradients that coarse grids struggle to represent
- Coasts: sea-breeze timing depends on small boundaries that can shift quickly
Weather forecasts are only as sharp as the observations that feed the model. In oceans and mountains, those observations are often the weakest link.
If you’ve ever watched clouds roll in and then wondered why rain shows up miles away, this is the reason. The planet is not equally visible to our instruments.
Human Choices and Expectations Shape Forecast Accuracy
Forecasting teams blend math and judgment, then send a message that people must use right away. Models can show patterns, but they do not know your exact street, your exact drive time, or your local history with lake effect snow. So accuracy depends on more than inputs, it depends on the human call, and on what the public expects to hear.
Meteorologists often build the final forecast from multiple model runs (ensembles) and then weigh what seems most plausible for the situation. In practice, that means watching trends like a coach reads a scoreboard, then adjusting when the game changes. Sometimes the trends hold. Sometimes the atmosphere flips a switch.
Lessons from Recent Forecast Wins and Fails
Recent 2025 to 2026 winter cases show both sides of the story, the “we nailed it” moments and the “how did that happen?” moments. The key is that these outcomes usually come from timing, scale, and decision-making, not blame.
On the win side, forecasters did a strong job with lake-effect snow affecting the Great Lakes early. In West Michigan, Grand Rapids saw major snow and the forecast narrative matched what often drives early-season totals. A local weather outlook from West Michigan media teams highlighted that early cold and the lake setup supported heavy snow through parts of December into January, aligning with how lake-effect bands tend to build when winds and cold air line up. You can see one local breakdown here: 2025–2026 Winter Weather Outlook in West Michigan.
Still, the headline expectation of 75 inches did not fully land. Grand Rapids did not hit the kind of sustained, repeatable snowfall rate that those big numbers imply. That mismatch shows how easy it is for the public to treat forecasts like guarantees. Weather teams often deliver confidence ranges and evolving odds, but people plan around exact totals anyway.
Then came a clear example of a fail, at least relative to early messaging: the bomb cyclone that struck the Northeast in late February 2026. The storm brought blizzard conditions, heavy snow, damaging winds, and widespread impacts. Some reports tracked it closely as it rapidly intensified, including map-based updates during the event: Tracking the February 2026 bomb cyclone. This kind of rapid intensification can catch forecasts off guard when the atmosphere lines up in a narrow window, like a lock turning at the last second.
So what changed? Often, it comes down to a mix of volatile upper-air patterns and human expectations about timing. Winter 2025 to 2026 also ran under a La Niña setup that stayed active and then shifted, which can encourage colder trends in some regions while also increasing the odds of sharp swings. When those swings interact with fast-developing storm systems, the atmosphere can amplify small differences into big outcomes.
One more factor matters behind the scenes: staffing. When teams feel short-staffed, they still work hard, but the system has less slack for extra updates, deeper checks, and faster coordination. Staffing strains at the National Weather Service have been reported as a real issue, and that can slow or limit certain forecast tasks that support warning decisions. Here’s one summary of the staffing impact: Staffing shortages and forecasting limits.
In the end, people want hour-by-hour certainty, but forecasters often deliver the best answer available, a blend of models, ensemble odds, and experience. When conditions evolve faster than expected, even careful choices can’t stop surprises from happening.
Bright Future: AI and Tech Closing the Accuracy Gap
Weather forecasts still miss sometimes, but the gap is shrinking. In 2026, AI and better tech help models spot patterns sooner, update faster, and handle uncertainty more clearly. Think of it like upgrading from a blurry windshield to a cleaner one, then adding smart sensors that help you react earlier.
However, the atmosphere still loves surprises, especially for rare events. That said, hybrid systems (AI plus physics) are doing the most work, and they’re already improving how well forecasters match reality, day after day.
Where 2026 is improving forecasts (and why it matters)
AI wins when it finds useful signals inside messy data. Then it helps the rest of the forecast chain do less guesswork.
Satellites also play a bigger role now. Instead of feeding only older, processed grids, newer pipelines push raw satellite information into AI models more directly. That improves how the system sees cloud structure, moisture, and storm organization before radar and surface reports fill in.
Meanwhile, many agencies are moving toward hybrids. These systems keep physics-based models for the “rules of the atmosphere,” then use AI to correct, extend, or accelerate parts of the process.
One strong example is NOAA’s AI-driven rollout. NOAA describes new AI weather forecast models added to its DESI system (used for impact-based decision support) in early 2026, and it also published an overview of its new generation of AI-driven global models. See NOAA’s AI models added to DESI and NOAA’s AI global model updates.
Tools that are pushing accuracy forward
These tools help forecasts in different ways, from minutes-ahead alerts to better hurricane track odds.
- NOAA Hybrid-GEFS: AI plus ensemble modeling to run faster and extend useful guidance.
- Google DeepMind WeatherNext 2: strong hurricane path prediction, built for many rapid scenario checks. Learn more via DeepMind’s WeatherNext 2 model overview.
- NVIDIA Earth-2: AI nowcasting and fast simulation for short lead times. See NVIDIA Earth-2 platform info.
- UK Met Office AI upgrades: AI support paired with physics and observation improvements, plus newer model science upgrades. Start with Met Office’s decision-making intelligence and its forecast accuracy model upgrade.
Why hybrids win, yet rare events still fight back
Hybrids help because they combine strengths. Physics models keep large-scale structure honest. AI adds pattern recognition and speed. As a result, forecasts often improve for common outcomes and higher-risk windows.
Still, rare events stay hard. A “once-in-a-while” storm can depend on tiny ingredients landing in the right place, at the right minute. Even with better tools, you can’t fully erase uncertainty, you can only reduce it.
Bottom line: 2026 systems are not just predicting better weather. They’re helping people plan and act sooner, which matters when seconds count.
Conclusion
Weather forecasting isn’t always accurate because the atmosphere changes fast, small errors grow, and models smooth the real world. In addition, data gaps in oceans and mountains can leave blind spots. Even so, forecasters use ensembles and smart judgment to communicate uncertainty, not false certainty.
Today’s forecasts are getting better, especially for short-term storms. AI and hybrid systems help models update faster, run more scenarios, and better handle missing data. If you want a practical edge, check ensembles and compare forecasts from multiple sources, including apps that use AI, like Google’s weather tools.
Share a time when a forecast missed your plans in the comments, so others can learn too. What detail do you wish weather apps would show more clearly, the timing, the rain amount, or the risk level? Science keeps tightening the gap in 2026, one update at a time.