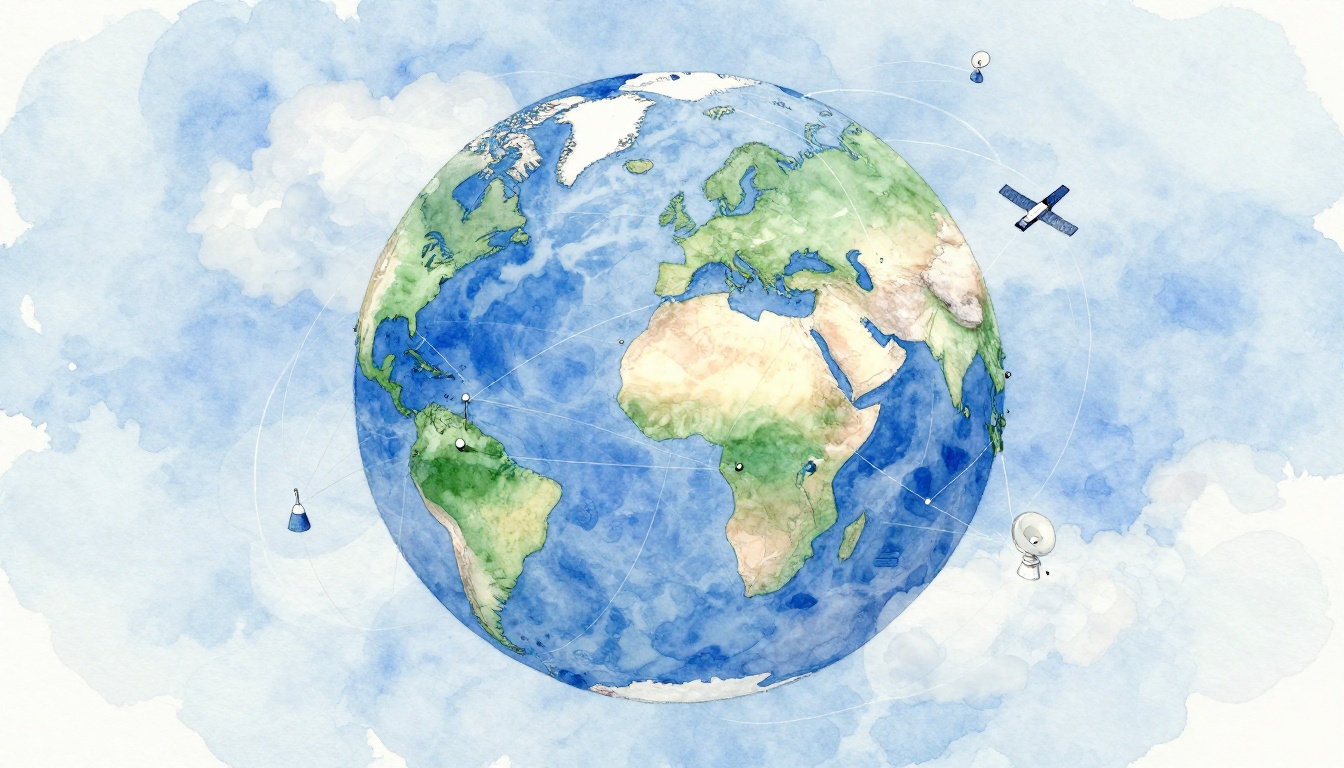
Your weather forecast is built from thousands of tiny measurements. When storms hit, that data can help save lives. Behind the scenes, weather data collection worldwide works like a giant nervous system. It connects instruments on land, in the sky, and at sea.
But how does that all get gathered across deserts, mountains, cities, and remote islands? The answer is teamwork, plus smart tools. Ground stations spot conditions near you. Radiosondes and aircraft fill in the atmosphere above. Radars and satellites watch storm systems from wide angles. Oceans add their own signals too.
Once those observations exist, they have to be shared, checked, and stitched together. That is where the World Meteorological Organization (WMO) matters. WMO coordinates the Global Observing System (GOS), so many countries can use the same observing framework and improve forecasts for everyone (WMO Global Observing System (GOS)).
Next, you’ll see the main ways the world collects weather data, from simple gauges to orbiting satellites, plus the newer methods starting to join in.
Ground Stations: Tracking Weather Right Where We Live
Most weather starts close to the ground. So the first layer of collection happens right where people live, work, and travel. Surface stations record temperature, wind, pressure, rainfall, and more. In many places, the stations run 24/7, sending data back in near real time.
Think of ground data like the “spelling” of a weather story. If you get it wrong, every sentence afterward can feel off.
In the U.S., the National Weather Service runs observation networks and organizes station types to support forecasts across regions. You can see how that backbone fits together in NWS’s explanation of its observation networks (Observation Networks – National Weather Service). Some networks focus on local alerts, while others support aviation, marine, climate, and flood forecasting.
Stations come in two big styles. Manual stations rely on people to read instruments and report conditions. Automatic stations use sensors that record every few minutes. Then software bundles the data for analysis.
Here’s a helpful analogy. A rain gauge works like a measuring cup. Instead of guessing, it collects water and shows how much fell. For wind, an anemometer works more like a spinner that tells you speed and direction. When pressure drops or winds turn, those changes often show up first on the ground.
Besides, ground data also helps check everything else. Satellites and radars estimate conditions from afar, but surface stations confirm what’s actually happening.
In practice, ground stations are the daily reference point. They help forecasters notice trends early, then update warnings when storms evolve.
Automatic Weather Stations in Action
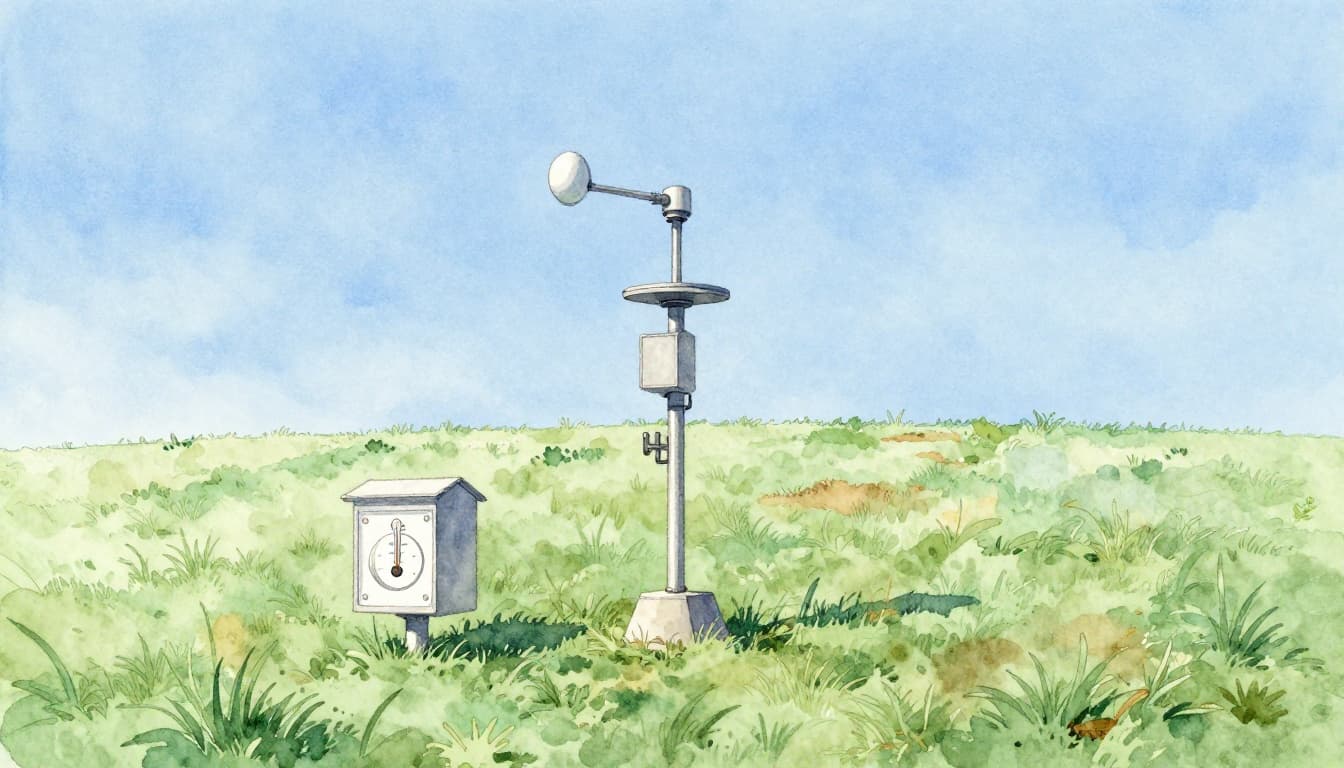
Automatic weather stations use sensors and simple electronics to record conditions. Temperature comes from thermometers inside protective shelters. Humidity sensors track how moist the air feels. Pressure sensors measure how hard the atmosphere presses down.
Wind is trickier because it changes fast. Anemometers and wind vanes help measure speed and direction. Some sites also include systems that watch rainfall intensity, not just total rain.
Once sensors record values, the station packages them and sends them onward. That transmission can use cellular networks, radio links, or internet connections depending on location. In remote areas, stations often rely on satellite communication.
Automatic stations matter most when conditions shift quickly. For example, a front can move through overnight. If your station updates every few minutes, forecasters can see the temperature drop and wind shift as it happens.
In addition, dense station networks can fill gaps. The National Mesonet Program describes a “network of networks” model that improves coverage for surface and boundary layer observations across the U.S. (National Mesonet Program Overview | National Mesonet Program). That means more data points when traditional sites are sparse.
Everyday Instruments Every Station Needs
Every surface station includes tools that measure basic weather elements. Even when instruments differ by brand, the measurement goals stay similar.
Common instruments include:
- Rain gauges: Collect precipitation to estimate how much fell.
- Anemometers: Measure wind speed.
- Wind vanes: Indicate wind direction.
- Thermometers: Track air temperature.
- Barometers: Measure air pressure.
A station needs good exposure too. Sensors must sit where sunlight and airflow are representative. That’s why many installations use a sheltered housing for temperature and humidity sensors.
When home weather stations connect to national networks, they often face different standards. Still, the basic idea stays the same: sensors observe, then data gets shared. If you own a home station, you’re seeing the same weather fundamentals used by pros.
For a look at how observation equipment is organized and why it matters, NOAA lists details about its observation systems and equipment approaches (NOAA Observation Systems). The goal is consistency. When instruments follow good rules, the data can be trusted in models and alerts.
Reaching Higher: Upper Air Data from Balloons and Planes
Ground stations cover only a thin layer of the atmosphere. Storms, however, depend on what’s happening far above the surface. Wind shear, moisture, and stability shape how thunderstorms grow. So forecasters need “vertical” data too.
That’s where upper air observations come in. These measurements describe temperature, humidity, and pressure at height. They also capture winds aloft, which help track storm motion and rotation.
Two major sources feed upper air data. Radiosondes ride balloons upward. Aircraft collect observations during flights.
Upper air information improves forecast skill because it fills in the atmosphere between the ground and the clouds. In other words, it turns a surface snapshot into a 3D model input.
And yes, it can feel surprising. A balloon can gather secrets from the sky and send them down fast.
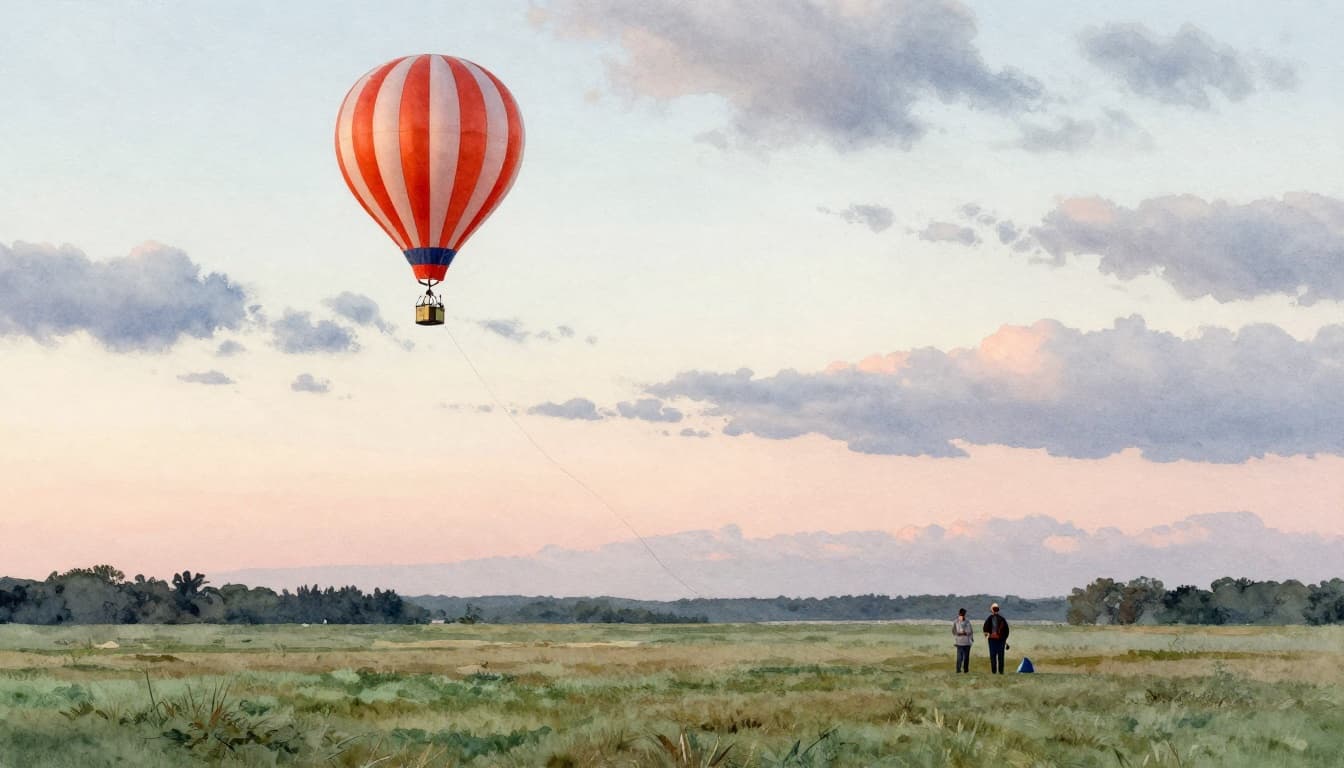
Radiosondes: The High-Flying Data Collectors
A radiosonde is a compact weather instrument attached to a balloon. Teams launch it, often twice daily worldwide. The balloon rises over 100,000 feet. During the climb, the radiosonde measures temperature, humidity, pressure, and other variables.
At the peak, the balloon bursts. Then the package falls back, usually with a parachute. Many systems aim to recover equipment or at least ensure safe descent.
Radiosonde launches take planning and staffing. That is where real-world challenges show up. For example, 2026 reports note that some U.S. balloon schedules have faced reductions due to staffing shortages. Even so, radiosondes remain one of the most important sources for reliable atmospheric vertical profiles.
If you want to see how the U.S. handles upper-air observing, the National Weather Service explains its Upper-air Observations Program and the types of data it uses (Upper-air Observations Program – National Weather Service). NASA also hosts datasets tied to radiosonde campaigns and processing, which can help researchers work with these observations (Radiosondes WHyMSIE | NASA Earthdata).
Seeing from Afar: Radars and Satellites Watch the Skies
Satellites and radar act like your weather eyes. One looks down from space. The other paints the sky with pulses from the ground. Together, they help forecasters identify storm type, intensity, and movement over large areas.
Radars also help with warnings. They can detect heavy rain and hail, and they can show wind patterns inside storms. Satellites help too, especially over oceans and places without dense ground stations.
How Weather Radars Spot Storms Before They Hit
Most modern weather radars use Doppler technology. They send out radio pulses and listen for echoes. When raindrops or hailstones move, the returned signal shifts in frequency.
That shift lets radar estimate:
- Where precipitation is
- How strong it is
- How it moves
Forecasters often use radar “slices” that update as the dish rotates. The radar beam sweeps across the sky at different elevation angles. By combining those scans, systems can build a 3D picture of storms.
Radar range still matters. A storm farther away may appear less detailed. Still, even coarse radar tracking can improve timing for watches and warnings.
If you’re curious what radar and satellite products look like in the U.S., the National Weather Service keeps public pages with radar and satellite imagery for local regions (Radar and Satellite Images – National Weather Service).
Satellites: Earth’s Weather Watchdogs
Satellites see cloud cover, storm structure, sea surface temperature, and more. They also help detect atmospheric moisture patterns that are hard to observe from the ground.
Two main satellite types do the job:
- Geostationary satellites stay fixed over one region, giving frequent updates.
- Polar-orbiting satellites pass over Earth from pole to pole, building global coverage.
Here’s a quick comparison of how their orbits affect what they can observe.
| Satellite type | Where it sits | Best at | Typical benefit |
|---|---|---|---|
| Geostationary | Above the same point over time | Rapid storm changes | Frequent “watch it evolve” views |
| Polar-orbiting | Sweeping across the planet | Global mapping | Better full-world coverage |
As a result, meteorologists use geostationary views to monitor hurricanes and rapidly growing thunderstorms. They use polar-orbiting data to fill in broader details like temperature patterns and cloud properties across continents and oceans.
Ocean Watch: Buoys, Ships, and Drifting Floats
Weather doesn’t stop at shorelines. The ocean stores heat and moisture. It can also fuel storms, especially when sea surface temperatures are high.
So the global observing system includes marine measurements. These observations help with hurricane forecasting, monsoon tracking, and climate monitoring.
Marine data comes from several sources:
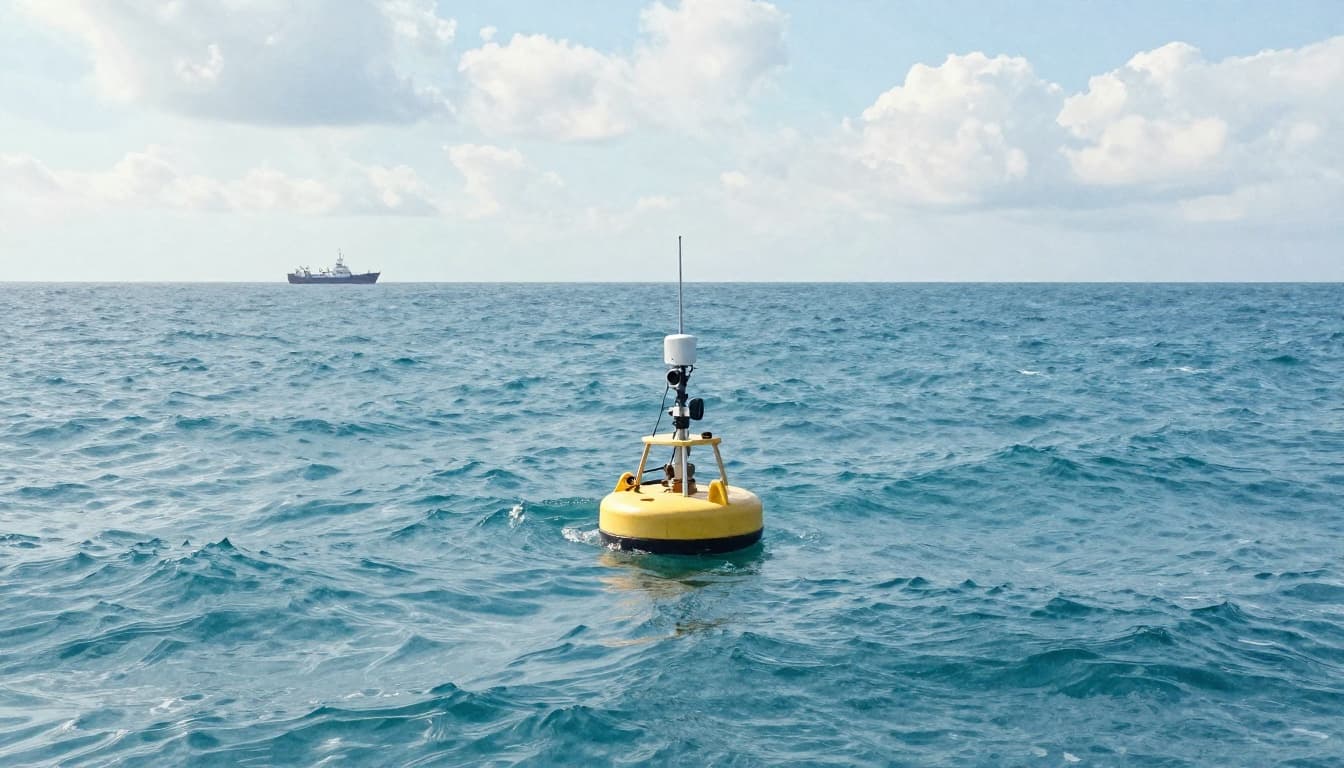
- Moored buoys fixed in place
- Ships reporting conditions during travel
- Drifting floats that travel through the ocean for longer profiles
Buoys often measure wave height, wind, air temperature, water temperature, and pressure. Ships also observe, although they depend on routes and schedules.
Drifting floats like Argo add another layer. They dive deep, then rise to the surface to transmit data. That gives scientists temperature and salinity profiles down to large depths. Those profiles help models represent ocean heat and mixing more accurately.
For a clear overview of how Argo provides temperature and salinity profiles, see the Climate Data Guide summary (Argo Ocean Temperature and Salinity Profiles – Climate Data Guide).
Buoys and Ships on the Front Lines
Moored buoys act like steady “weather anchors.” They report conditions continuously, which helps forecasters see changes in wave energy and wind patterns. That matters because ocean state and air-sea exchange influence storm intensity.
Drifting systems add coverage where moored sites are sparse. Even though floats travel, their widespread deployment helps create a near global grid for ocean temperature and salinity.
Ships, meanwhile, provide opportunistic observations. Automated systems can report atmospheric pressure, wind, and sea conditions while vessels move. That data can still be valuable, especially in regions with fewer buoys.
Put together, ocean observing reduces blind spots. It also improves climate records over time.
New Frontiers: Drones, Crowdsourcing, and Smart Tech
By 2026, weather data collection isn’t limited to traditional instruments. New systems help fill gaps in the lower atmosphere, where observations can still be sparse.
Drones can fly into locations too dangerous or too hard for people. Citizen science helps collect reports when storms roll through towns. Meanwhile, advanced computing helps blend all the information into better model runs.
The big idea is simple: more observations help models. However, more data also means more quality control and better data handling.
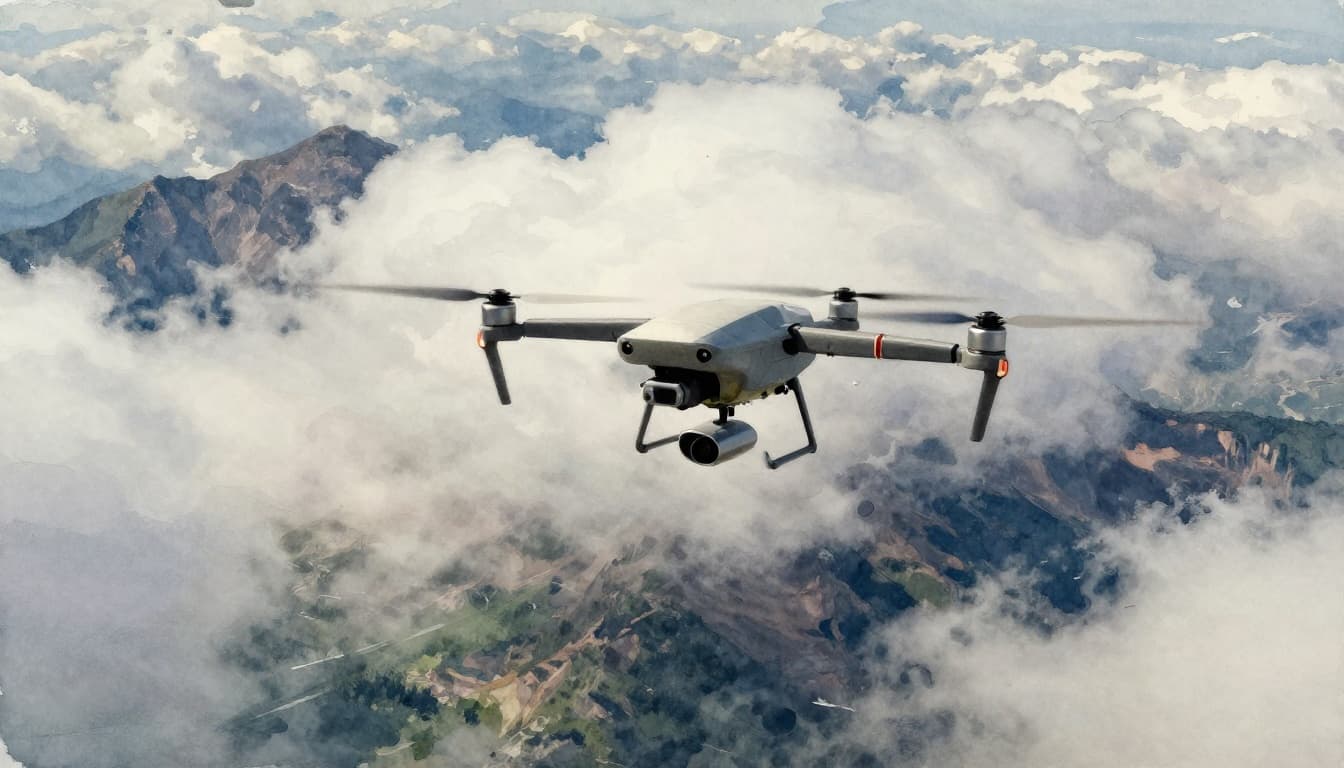
Drones and Everyday People Joining In
Drones can collect measurements in the lower and middle atmosphere. They can also reach areas where a balloon launch is difficult.
One example getting attention is Meteodrones, which a 2026 report says has been integrated into NOAA’s National Mesonet Program for operational forecasting use (Meteodrones Provide New Data to National Weather Service). That matters because many classic observation gaps show up near the ground.
Citizen reports can help too. Apps may ask people to submit rain type, visibility, or hail observations. It’s not a replacement for radar or gauges. Still, it can support situational awareness, especially during fast storms.
Meanwhile, drone missions can be carefully planned. Teams can target the air just above roads, valleys, or coastal zones. That can improve how forecasters interpret what radar and satellites infer.
AI’s Role in Smarter Weather Predictions
AI helps in several ways. First, it can spot patterns quickly across large datasets. That supports tasks like quality checks and anomaly detection. Second, it can improve how data gets combined into forecasts.
Most weather centers still rely heavily on physics-based models. But AI and machine learning can assist with parts of the workflow. For example, they can help assess whether a sensor looks like it’s behaving normally or if an instrument drifted.
Another important piece is data assimilation. This is the process that blends observations into model initial conditions. In practice, assimilation improves when more observation types arrive, from surface stations to aircraft to marine sensors. The end result is a model that starts closer to the real atmosphere.
To make that work at global scale, WMO also pushes integration. Its WMO Integrated Global Observing System (WIGOS) framework describes how it aims to connect observing systems across countries (WMO Integrated Global Observing System (WIGOS)). That integration matters, because one country’s sensors can strengthen another region’s forecasts.
Conclusion
Weather data collection worldwide is a layered system. Ground stations measure what you feel near the surface. Radiosondes and aircraft fill in the vertical atmosphere. Radars and satellites track storms over large areas. Buoys and floats add what the ocean contributes.
The strongest theme is coordination. WMO’s observing frameworks help countries share compatible data, so forecasts improve everywhere, not just in one region.
Now, here’s a simple next step. Check your local station data through public weather sites, and notice how often updates appear. If you want to go further, join citizen science during storm seasons, or learn how radar and satellite products work in your area. When you understand the inputs, you understand the forecast. And that makes you safer when the sky changes fast.