
Ever checked your phone for rain before a picnic, then watched the sky do something totally different? That gap between expectation and reality is where weather models come in. They’re the math-and-supercomputing engines behind most forecasts.
Weather apps don’t guess. They run weather forecasting models that simulate how the atmosphere changes over time. Then they update the results as new observations roll in.
In this guide, you’ll learn what weather models are (in plain language), how they work step by step, and which major models forecasters lean on in 2026. You’ll also see why model runs can disagree, and what the limits look like when you plan next week.
What Are Weather Models? Your Simple Breakdown
A weather model is a computer simulation of the atmosphere. It uses physics, math, and real observations to estimate future weather. In other words, it tries to answer: “If the air is moving like this right now, where will it go next?”
Most modern models run numerical weather prediction (NWP). That means they solve equations that describe moving air, heat changes, moisture (water vapor), and other key processes. The model converts today’s weather into a grid of points, then calculates how conditions shift from one point to the next.
Weather models are popular because they can forecast many things at once, not just rain. You typically see outputs like:
- Temperature and heat index
- Wind direction and speed
- Cloud cover
- Rain, snow, and thunderstorms
- Pressure patterns that drive weather systems
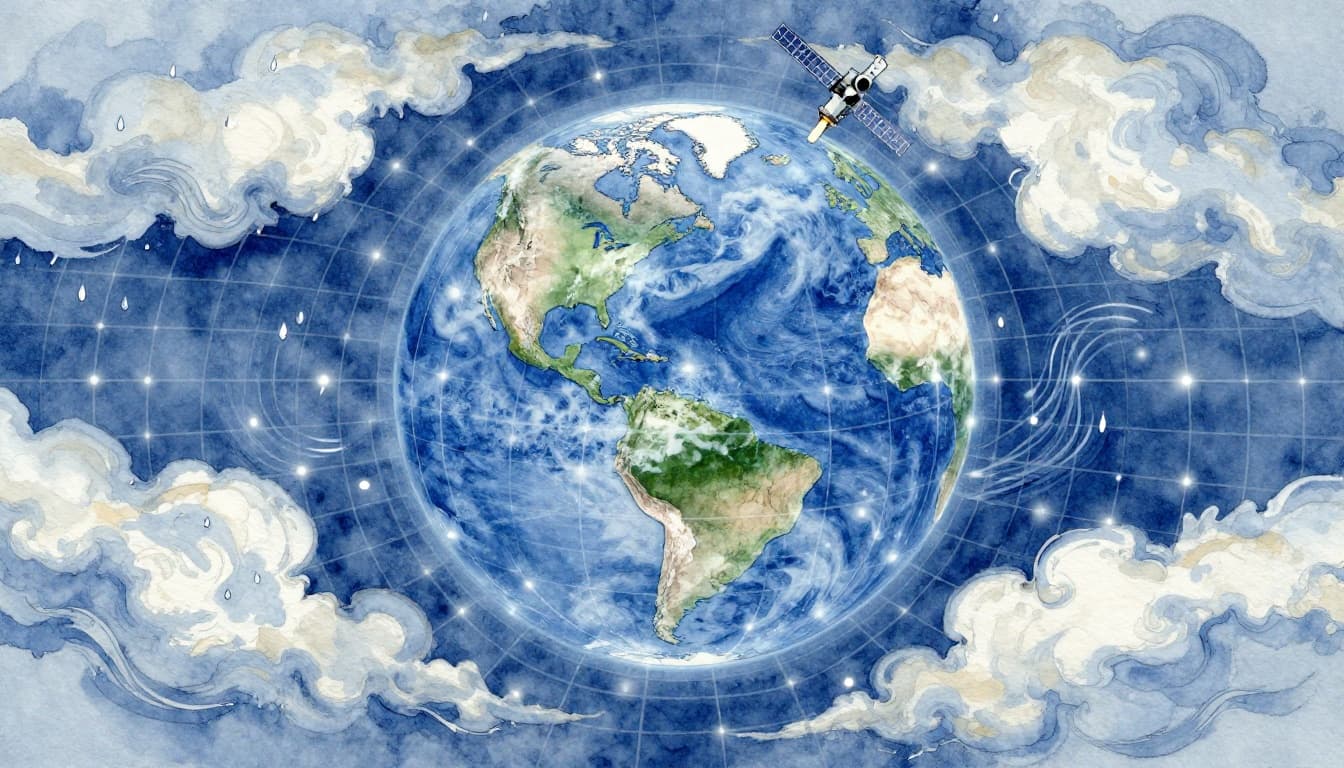
Where do the “today” inputs come from? From an observation network that includes satellites, radar, weather stations, and weather balloons. Even ocean data matters. These inputs get blended into the model’s starting state, so the simulation begins close to reality.
If you want a solid, plain explanation of NWP and why it’s done this way, NOAA’s NCEI has a good overview here: Numerical Weather Prediction basics (NCEI).
Here’s a helpful analogy. Think of the atmosphere like a video game world made of tiny tiles. Your controls are the math equations. Your pixels update every time step. If one tile starts slightly wrong, the pattern can drift as the simulation continues.
That’s why you’ll sometimes see different forecasts for the same day. Each model has different resolution (how fine the grid is), different methods, and different ways of handling small-scale storms and cloud processes.
How Do Weather Models Work? Step-by-Step Guide
Weather models don’t work like a single “magic forecast button.” They work like a chain reaction. First, the model must know the current state. Then it has to compute what the atmosphere does next.
The core method is NWP, and it follows a fairly consistent workflow across major centers:
- Data assimilation: Gather observations and blend them into one best starting picture.
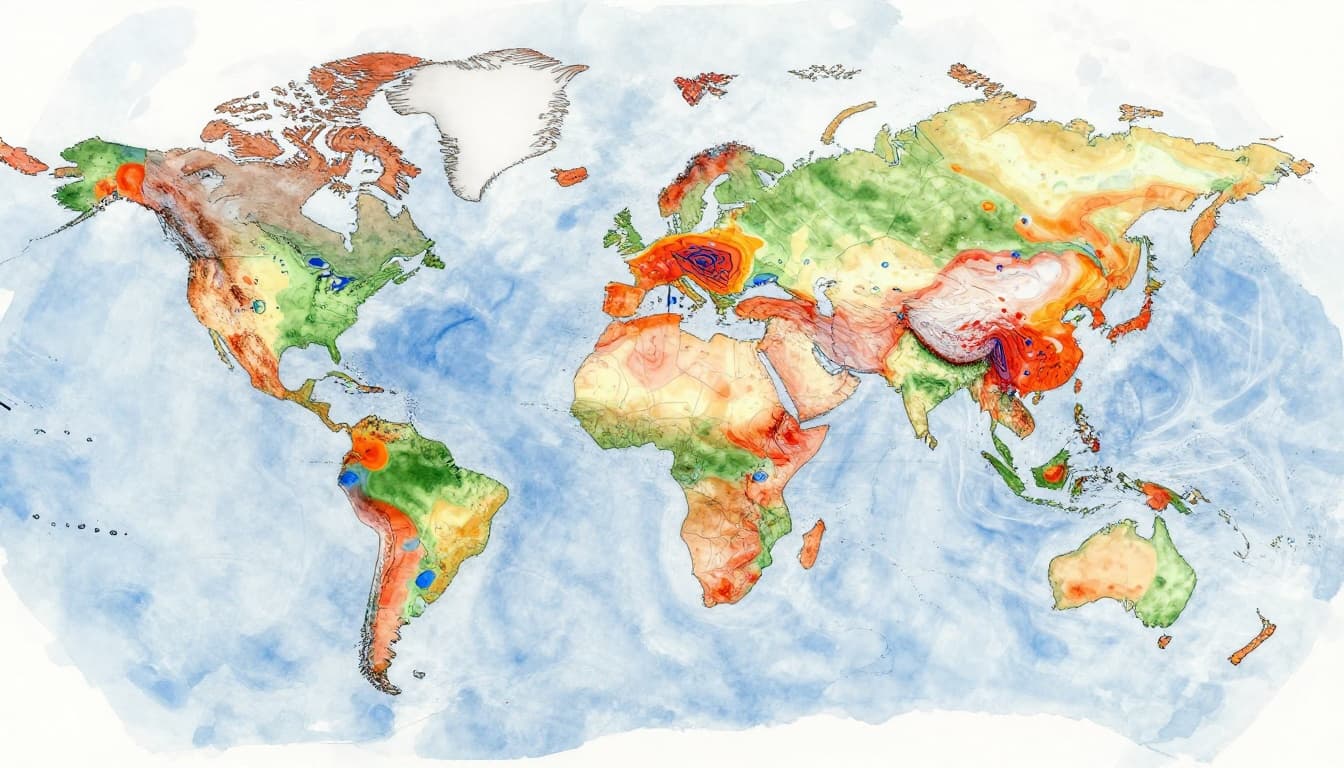
- Build a 3D grid: Split Earth or a region into many points (height, latitude, longitude).
- Run physics on the grid: Calculate how winds, heat, and moisture evolve at each point.
- Step forward in time: Compute future conditions in small time jumps (often minutes).
- Publish outputs: Generate maps, tables, and forecast “products” people can read.
- Update often: As new data arrives, centers rerun the models and refresh guidance.
Data assimilation is especially important. If the starting point is off, the later forecast can drift fast. That’s not because the model “forgot” later physics. It’s because the atmosphere is chaotic, so small errors grow with time.
For a more technical, but still readable walkthrough of how NWP uses governing equations and computer code, see this NOAA PDF: Numerical weather prediction explained (NOAA).
Also, watch forecast timing. Most centers update several times daily. Some high-resolution models update hourly. So your app may show a “new forecast” simply because a new model run finished.
Meanwhile, the results you see are often not one single run. Many systems also run ensembles, which use slightly different starting conditions. Ensembles help show uncertainty, not just one line of “what will happen.”
Gathering Data: The Foundation of Accurate Starts
Before any model can forecast, it needs a starting snapshot. That snapshot comes from data assimilation, which blends lots of imperfect inputs into one system.
Key data sources include:
- Satellites (clouds, moisture, temperature aloft)
- Weather balloons (upper-air winds and temperature)
- Radar (precipitation and storm structure)
- Surface weather stations (temperature, humidity, pressure)
- Ships and buoys (especially over the oceans)
The atmosphere doesn’t sit still while you observe it. Also, instruments differ in timing and accuracy. So centers use mathematical methods to merge observations and control how much each data type should influence the starting grid.
That’s why “garbage in” can still mean “garbage out.” Not because a model is careless, but because every observation has errors. Even great radar data only covers certain distances and angles. Satellite retrievals also depend on algorithms.
You’ll often hear forecasters talk about whether the model “has good initial conditions.” That’s a shorthand for how well the blended input represents the real atmosphere right now.
In short, data assimilation is where forecasts get their first correction step.
Physics in Action: Crunching Equations on a Grid
Once the starting point is built, the model turns physics into computer updates. It takes the atmosphere and breaks it into grid points in 3D space.
At each grid point, the model estimates things like:
- Wind speed and direction
- Temperature changes
- Moisture and cloud-related variables
- Pressure tendencies that steer flow
Then it calculates how those values change over each time step. Most models are based on fluid dynamics and thermodynamics, meaning they represent air as a moving, compressible fluid with heat and moisture.
However, not everything is directly resolved. Small clouds, tiny turbulence, and cloud microphysics are often too small for the grid to fully capture. So models use parameterizations, which are approximations for sub-grid processes.
For a deeper, model-focused explanation of NWP systems and how they represent atmosphere physics, you can reference this guide: Comprehensive guide to weather models (meteoblue).
Think of it like trying to predict traffic across a city. If you track every single car, you can be extremely precise. If you track traffic flow by blocks, you still get value, but you must model how fast local bottlenecks form.
Weather models do the same thing with the atmosphere.
Forecasting Forward: From Now to Next Week
Now comes the time stepping. The model advances forward from “present” to “future” in repeated jumps.
As the forecast length increases, uncertainty increases too. That happens because:
- The atmosphere is chaotic, and errors grow
- Observations get sparser in time (you can’t measure everything constantly)
- Coarser grids can miss smaller features
That’s why short-range forecasts are typically more reliable. A near-term wind or rain band can look sharp because the system hasn’t had much time to drift.
Also, when you check forecasts later in the day, you might see changes. Those changes reflect the latest assimilation, plus any new data that the model received since the last run.
One more detail: many systems run multiple forecasts (ensembles). Then they summarize the range of outcomes. That’s why you may see probabilities or “most likely” outcomes in some apps.
In plain language, ensembles are the model’s way of saying: “Here’s what we think, and here’s how sure we are.”
Top Weather Models Leading Forecasts in 2026
No single model wins every time. So forecasters and weather apps often compare multiple guidance sources.
Below is a quick comparison of major systems used for public and operational forecasts. Model setups can change over time, so treat these as typical characteristics of the model families.
If you want model chart pages that summarize several global and regional systems, Weather.us has a model chart hub here: Model charts for major models (Weather.us).
Here’s the high-level view:
| Model | Typical coverage | Typical resolution | Typical forecast range (public guidance) | How often it runs | Common strengths |
|---|---|---|---|---|---|
| GFS | Global, US-centered output | About 13 km in many setups | Up to ~16 days | Several times daily | Large-scale patterns, useful for broad outlooks |
| ECMWF (IFS) | Global, Europe-centered | High-detail grid | Around ~10 days | Multiple times daily | Often strong medium-range skill worldwide |
| UKMO | Global with strong North Atlantic focus | Fine detail (varies) | Around ~10 days | Multiple times daily | Useful for storm track and jet-stream evolution |
| NAM | North America | Around 12 km | ~2 to 3 days | 4 times daily | Regional detail, good for near-term shifts |
| HRRR | US regional | Around 3 km | Under ~48 hours | Hourly | Great for short-term storms, wind, snow bursts |
| ICON / GEM | Global or regional options | Varies by setup | Varies | Frequent runs | Helpful alternatives, often strong in certain regions |
A key 2026 trend is faster systems and AI help in parts of the workflow. Real-time updates point to ECMWF’s AIFS approach using AI to speed and sharpen prediction components. That’s one reason you’ll see some changes in model behavior and timing across seasons.
When models disagree, ensembles often explain the “why.” They show whether the atmosphere is predictable at that time scale.
Global Powerhouses: GFS, ECMWF, and UKMO
Global models cover the whole planet, so they’re built to handle big systems like troughs, ridges, and jet-stream shifts. In the US, that means they’re often the first place you look for medium-range temperature and pressure patterns.
ECMWF is widely regarded for accuracy in the medium range. In 2026, it also benefits from ongoing improvements, including AI-integrated components such as AIFS. That matters because medium-range errors can strongly impact your week-ahead planning.
GFS is a workhorse for the US. It’s known for steady updates and solid skill in broad patterns. Even when it’s not the top performer on every metric, it’s valuable because it runs often and gives consistent guidance.
UKMO frequently does well for North Atlantic and Europe storm evolution. Since many US weather patterns start with upstream flow, UKMO can be a useful check when storm tracks become important.
In practice, comparing globals can help you decide what to trust. If ECMWF and GFS align on a storm pattern, your confidence goes up. If they diverge sharply, you may want to wait for later runs or check ensembles.
Regional Stars: NAM, HRRR, and Beyond
Regional models focus on a smaller area with higher detail. They’re where forecasts get more “local,” like how fast a line of storms will move or how a snow band will set up.
NAM is common for US near-term guidance. Because it zooms in, it can represent regional features better than a global model with a coarser grid.
HRRR is especially well-known for very short-range forecasting. It often shines for hours-ahead decisions because it runs hourly and has fine grid spacing. If you’ve ever watched an updated forecast change for your exact county, you’re seeing the impact of high-resolution modeling.
There are also specialized models depending on the weather topic. For storms and aviation planning, some meteorology communities lean on particular forecast products and model guidance. IFR Magazine also covers how forecast models fit into operational decision-making in aviation contexts here: Forecast models in aviation (IFR).
If you live where weather can shift fast, regional guidance helps you plan. If you’re planning a week out, global models often set the bigger picture.
Strengths, Limits, and Exciting Advances in Weather Modeling
Weather models are powerful because they’re physics-based and data-driven. They don’t just fit past data. They compute how the atmosphere should evolve from a current starting state.
Still, there are real limits. The main one is predictability. After about a week (often earlier for complex weather), forecast skill drops. Small initial errors can grow quickly. Plus, grid resolution limits how well the model can represent tiny storm-scale details.
Here’s a quick way to think about it:
- Strengths:
- Can forecast large-scale weather patterns (wind, rain zones, temperatures)
- Improves over time with better data and better numerics
- Helps with safety planning for storms and high winds
- Limits:
- Uncertainty grows after several days
- Coarser grids miss small features (especially fast thunderstorm dynamics)
- Data gaps over oceans and remote areas can reduce confidence
Now for 2026 momentum. Recent updates emphasize:
- Higher resolution in key systems and improved ensemble setups
- More observations from satellites and better data blending
- Continued AI integration alongside physics-based core modeling
- Better severe weather guidance timing and display, based on updated model runs
Overall, the trend is clear. Weather modeling keeps getting better, and it’s getting better faster. But it still requires human judgment, because the atmosphere does not act like a perfect script.
The most useful habit is to check the trend across runs, not just one screenshot.
Conclusion
Weather models are computer simulations that forecast future conditions by solving physics equations on a grid. They work best when data assimilation gives the model a strong starting point, then the simulation marches forward in time.
In 2026, the biggest names include ECMWF, GFS, and UKMO for global guidance, while NAM and HRRR often drive the finer local details. Comparing models matters because each system has strengths, and the atmosphere can be unpredictable.
The core takeaway is simple: models help you plan smarter, but uncertainty is part of the forecast. So check trends, compare guidance, and remember that short-range detail usually beats long-range certainty.
What’s the last forecast that surprised you? Share your weather story in the comments, and subscribe if you want more science explained in plain words.