A sudden storm can pop up faster than your plans. In March 2026, forecasters flagged a high risk for damaging winds, hail, and possible tornadoes well ahead of time. When people treat those alerts as a heads-up, they often get out of harm’s way sooner.
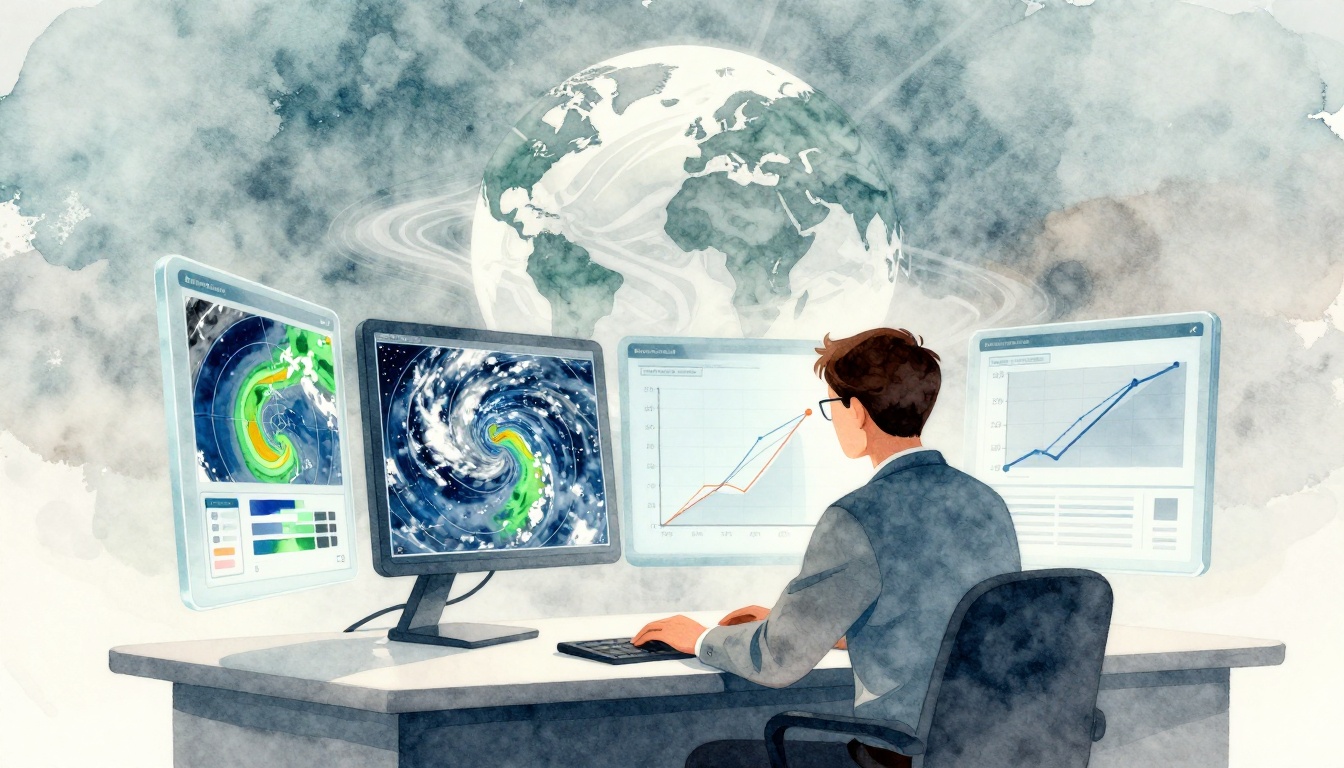
That’s where how meteorologists analyze weather data matters. Behind the scenes, meteorologists turn messy measurements into clear forecasts. You see the final result on your phone, but you also benefit from it when you decide whether to drive, bike, or stay home.
Meteorologists rely on a mix of tools and a steady workflow. They gather data from satellites, radars, and weather stations. Then they clean it, because sensors miss things and errors happen. Next, they run models (and increasingly, AI) to estimate what the atmosphere will do next. Humans review the output, adjust for local quirks, and publish warnings. Finally, they verify what happened after the storm passes, so the next forecast gets better.
Let’s break down the inputs and the process, in plain English. Once you see the full chain, weather apps feel less like magic and more like a careful science.
What Key Sources Feed Weather Data into Meteorologists’ Hands?
Think of weather data like ingredients. No single source tells the whole story. Instead, meteorologists blend weather data sources that see different parts of the atmosphere.
Satellites act like eyes in the sky. Radars watch storms in real time. Ground stations provide the baseline at the surface. Balloons measure the air above you, layer by layer. On top of that, aircraft data and even some crowd reports can fill gaps.
For basics on what observations exist and how they’re collected, NOAA’s education resources are a helpful starting point: weather observations from NOAA.
Here’s how the pieces fit together.
| Data source | What it measures best | Why it matters for forecasts |
|---|---|---|
| Satellites | Cloud type, storm structure, temperature aloft | Spots storms early over large areas |
| Doppler radar | Rain, hail, wind shifts, storm rotation | Pinpoints where severe weather is hitting now |
| Weather stations | Surface temperature, pressure, humidity, wind | Confirms conditions on the ground |
| Weather balloons | Temperature and moisture by height | Helps models “see” the atmosphere better |
| Aircraft and other sensors | Wind and moisture where planes fly | Fills vertical and regional gaps fast |
In the U.S., a big share of this info comes from federal observing networks. If you’re curious where that data ends up and why your forecast can vary by location, NPR explains the public data pathway well: where your weather forecast comes from.
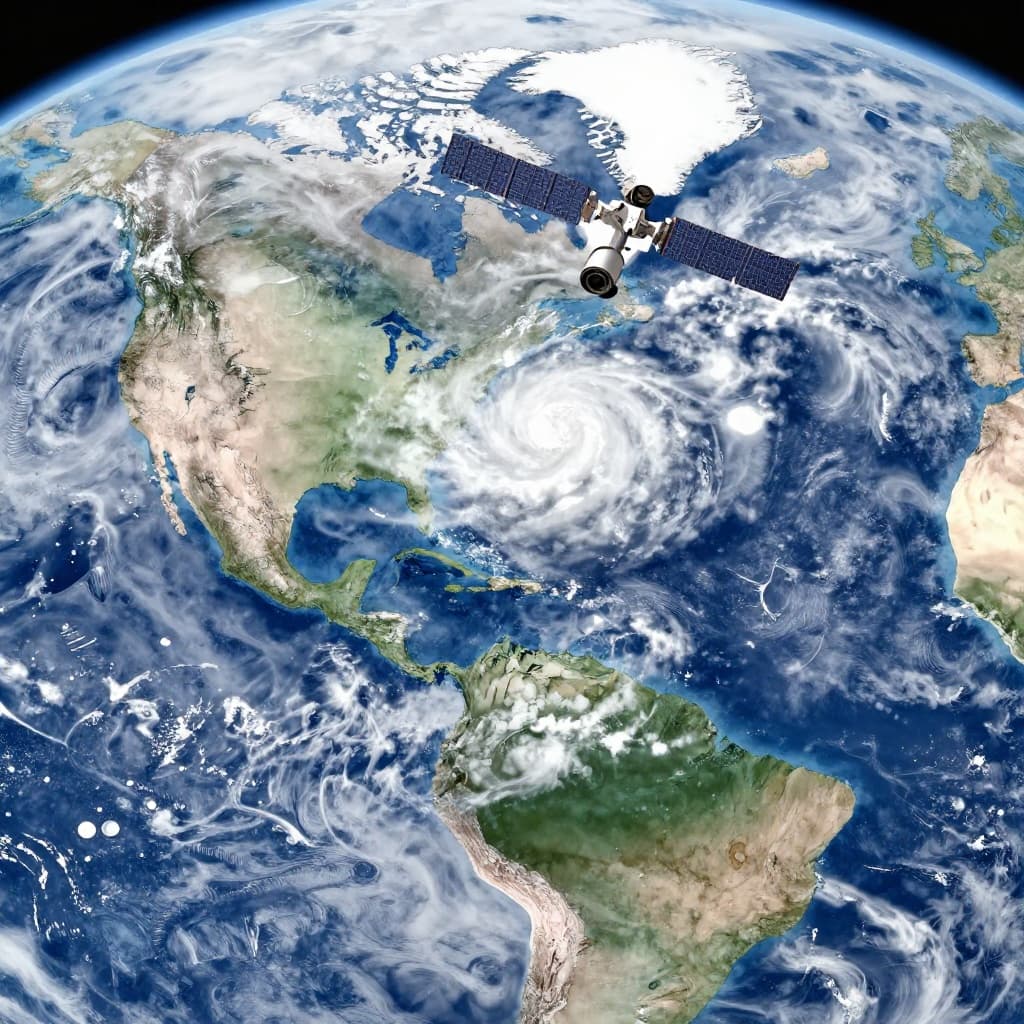
Satellites Deliver the Big-Picture Global View
Satellites don’t “feel” the air like a weather station does. Instead, they measure energy coming from Earth and the clouds. That’s how meteorologists infer what’s happening far away.
In simple terms:
- Infrared helps estimate cloud-top temperature, which links to storm strength.
- Visible light shows cloud shapes and storm organization.
- Microwave sensors can hint at rain and ice in clouds, even when clouds are thick.
Modern geostationary satellites keep watching the same region. That means meteorologists can track how a storm grows, twists, or weakens through the day. It’s especially useful for tropical systems and large storm complexes.
However, satellites have limits. They don’t directly measure surface wind speed the way Doppler radar does. Also, the view can miss fine details near the ground.
Still, satellites give the “where and when” signal. They’re often the first clue that something serious is forming, even if it’s still hundreds of miles away.
Radars Catch Storms Moving in Real Time
If satellites are the eyes in the sky, then Doppler radar is the scanner that watches the punch of the storm.
Doppler radar sends out pulses and measures what comes back. When precipitation moves toward the radar, the signal shifts one way. When it moves away, it shifts the other way. That gives meteorologists not just the location of rain or hail, but also the wind inside the storm.
Radar helps forecasters answer urgent questions:
- Where is the heaviest rain right now?
- Is hail likely near the ground?
- Is the storm rotating, which can raise tornado risk?
- How fast is the storm moving toward a town?
A good example is the moment a thunderstorm line approaches your area. You can watch storm cells grow and merge on radar. Then you often see warning criteria tighten when a new stronger core develops.
Weather Stations and Balloons Ground the Data
Satellites and radar are powerful, but surface truth matters. Weather stations provide that baseline.
Across the U.S., thousands of automated stations measure:
- temperature
- pressure
- humidity
- wind speed and direction
These numbers help confirm what radar and satellite estimates suggest. If models think a location is warmer than it really is, forecasts can drift.
Weather balloons, also called radiosondes, add another layer. They launch (commonly twice a day) and climb upward while transmitting temperature, moisture, and pressure. This creates a vertical profile of the atmosphere.
That’s crucial because storms run on layers. If the air just above your area is unstable, thunderstorm chances rise. If a layer is capped by stable air, storms may struggle to grow.
When data is missing, meteorologists also use extra inputs. Sometimes that includes crowdsourced reports and aircraft observations. The goal is always the same: reduce blind spots and improve the picture the models start with.
Walk Through the Step-by-Step Analysis Process Meteorologists Use
Meteorologists don’t just “run the forecast button.” They work through a chain, in order, so each part corrects the last.
You can picture it like this: raw observations are chaotic. Models try to organize that chaos. Humans check whether the pattern makes sense for the real world. Verification later tells everyone what worked and what didn’t.
Here’s the workflow most closely aligned with modern operations.
Step 1: Pulling in Data from Everywhere at Once
First, meteorologists gather live feeds from satellites, radars, stations, and upper-air systems. Then they load the information into forecasting systems.
Because the atmosphere crosses borders, teams also pull in global data. That helps especially for long-range planning and when storms move in from other regions.
This is a high-volume job. Weather systems generate massive amounts of data each day. Even when you ignore the details, the key idea is simple: the more complete the initial snapshot, the better the forecast.
Step 2: Scrubbing Data for Accuracy and Filling Gaps
Next comes quality control. Sensors can fail, return odd readings, or get blocked by clouds or terrain. For that reason, meteorologists run checks before using anything.
AI helps here, because it can flag patterns that look wrong. It can also smooth over missing points, using nearby observations and expected physics.
This step matters because small errors can grow. If one region starts with the wrong moisture level, the model may push storms in the wrong direction.
Step 3: Cranking Up Computer Models and AI Predictions
Then the real crunch begins. Numerical models simulate the atmosphere using physics equations. They estimate wind, temperature, pressure, and moisture over time.
Meteorologists often run ensembles too. Instead of one forecast, ensembles run many variations. That gives a sense of uncertainty, not just a single “best guess.”
At the same time, AI-based systems are growing in use. Some focus on improving short-term forecasts and handling complex storm behavior. Others help create better probabilistic guidance.
If you want a reminder that forecast skill can vary, consider this perspective on model limits from weather consulting: weathering the storm model deficiencies.
Step 4: Forecasters Add Human Insight and Local Smarts
After the computer output, humans still matter. Forecasters review model guidance, radar trends, cloud behavior, and storm history.
They also account for local factors that models might miss. Examples include lake effects, land-breeze boundaries, and how terrain can steer storms.
This is where experience shines. A trained eye can spot a setup that looks “off” compared with the usual pattern. Forecasters also check whether storms match the expected timing.
Step 5: Turning Numbers into Maps, Warnings, and Updates
Now the forecast becomes something people can use.
Meteorologists produce maps, probabilities, and time-based updates. They translate model guidance into decisions: where risk is higher, when it peaks, and which hazards are most likely.
For severe weather, warnings must update quickly. Radar can show rapid changes. That means the forecast is not a one-time product. It’s a living update loop.
Step 6: Checking Results to Get Even Better Next Time
Finally, meteorologists verify. They compare forecasts to what actually happened.
This verification improves models and methods over time. It also helps forecasters learn where errors tend to cluster. Over years, that feedback tightens forecast quality and increases confidence.
Even weather forecasts with strong skill never become perfect. For a broader view on why uncertainty is baked into weather, see: the long history of US weather forecasts.
What Tools and Tech Make Weather Analysis So Powerful Today?
The modern toolbox mixes physics-based models with AI methods. It also relies on faster computing and better data handling.
The goal isn’t to replace meteorologists. It’s to make forecasts more timely and more accurate.
Numerical Models Simulate Tomorrow’s Weather Step by Step
Numerical models solve equations that describe how the atmosphere moves. They track how heat, moisture, and air pressure evolve.
Because the atmosphere is chaotic, models work on grids and run for hours. In practice, forecasting centers run ensembles to estimate uncertainty.
Many places use global models plus regional upgrades. For example, ECMWF runs its Integrated Forecasting System for medium-range forecasts. ECMWF also releases open model resources through ECMWF OpenIFS for forecasting, which supports education and broader access.
If you’ve ever wondered why meteorologists talk about “initial conditions,” this is the reason. Models depend on the starting state. That’s why data quality control comes early in the workflow.
AI and Machine Learning Uncover Patterns Humans Might Miss
AI helps in two main ways. First, it can speed up pattern recognition. Second, it can improve guidance using training data from past weather.
AI approaches like forecast post-processing learn relationships between model output and what actually happened. That can reduce bias, which is a fancy word for repeated errors.
Other systems help generate fast probabilistic products. Because severe weather evolves quickly, faster tools can help forecasters react sooner.
In early 2026, NOAA had deployed new AI-driven global forecast models, including AIGFS and ensemble versions. For a direct overview, see this NOAA research update: NOAA deploys new AI global models.
The best results often come from hybrids. AI supports the process, while physics keeps the forecast grounded.
How 2026 Advancements Are Revolutionizing Weather Data Analysis
Weather analysis in 2026 is moving toward tighter teamwork between computers and people.
One shift is that AI isn’t just a “helper.” It’s becoming part of the forecasting pipeline. NOAA’s AI-driven systems, launched in late 2025, focus on faster prediction and better uncertainty estimates.
Another shift is improved ensemble thinking. Weather is uncertain, so forecasts need probabilities. AI tools can help produce those probabilities quickly, which matters for warnings.
ECMWF’s AI forecasting system (AIFS) also showed strong performance after going live in early 2025. By 2026, it’s paired with ensemble versions. That combination targets a simple truth: storms behave differently across scenarios.
At the local scale, AI and human review reduce common errors, including timing and intensity mismatches. That’s especially useful for hazards like heavy rain, severe wind, and winter storms.
So what does this mean for you? It means your forecast has more context. It also means warnings can update faster when conditions change.
Still, uncertainty never disappears. Even top tools can struggle when the atmosphere surprises everyone. That’s why the verification step and continuous improvement matter.
When you read a forecast, you’re looking at a process that keeps learning. And in 2026, that learning loop is getting stronger.
Conclusion
Meteorologists analyze weather data by combining many sources, then following a careful workflow. Satellites show the big picture, radar captures storm structure in real time, and stations plus balloons ground the atmosphere’s layers.
Next, they clean the data, run models and AI forecasts, and then apply human judgment for local detail. Finally, they verify what happened, so future forecasts improve.
The strongest takeaway is simple: better forecasts come from better inputs and better feedback. So the next time a storm warning pops up, treat it as the end of a smart process, not guesswork. Check your local forecast, and if you want updates on new tools, leave a comment or subscribe for more explanations of how meteorologists analyze weather data in everyday life.