
You check the forecast for your picnic, see 30% chance of rain, and feel pretty safe. Then the sky dumps water anyway.
If you’ve ever thought, “So what does chance of rain meaning, exactly?” you’re not alone.
In the US, most apps show Probability of Precipitation (PoP). It’s a specific kind of probability tied to your exact spot, not your whole town. In other words, it tells you the odds that measurable rain will hit somewhere over a forecast area during a set time.
Let’s decode chance of rain explained in plain English. We’ll use NOAA’s definition, show how forecasters compute it, and bust the myths that lead to forecast surprises.
The Official Definition from Weather Pros Like NOAA
When you see “chance of rain,” the real measure is PoP, or Probability of Precipitation. The National Weather Service explains it this way: PoP is the chance that at least 0.01 inch of rain (or the melted-snow equivalent) will fall at any point in the forecast area during the forecast time period. That time period might be 12 hours, for example.
That detail matters. PoP is not “percent of the day it rains.” It’s also not “percent of your city that gets wet.” It’s about whether measurable precipitation reaches your forecast point.
You can see NOAA/NWS explanations of PoP here: What Does Probability of Precipitation Mean?.
Think of the forecast area like a big grid around your neighborhood. Your house sits in one square. PoP tries to estimate how likely it is that at least a tiny amount of rain will land in that square (not just somewhere far away).
Also, the forecast applies to a specific time window. “Tuesday afternoon” and “Tuesday night” are different chances, even if the percent looks similar.
Precipitation at Your Spot, Not Everywhere
Here’s the part that trips people up: PoP does not mean all of the forecast area gets rain at once. Instead, it’s a probability for your location inside a mapped forecast zone.
A zone can cover more than you think. So when the forecast says 30%, it might mean:
- Your block has a decent shot at a light shower
- A nearby neighborhood could be dry
- Some spots get measurable rain, others get none
Even a higher PoP like 80% still allows for misses. Weather varies over short distances. Two streets can have different outcomes during the same storm.
That’s why “point forecast” is key. Your weather app is trying to match your location to the right forecast zone and time period, then show PoP for that matchup.
What Counts as “Measurable Rain”
PoP uses a measurable threshold. The standard is 0.01 inch of rain, which is about 0.25 mm. Trace amounts usually do not count.
So if you walk outside and see a few drops, that might feel like rain. But it might not meet the “measurable” cutoff for PoP reporting.
To visualize the threshold, think small but real. The forecast is basically saying: will enough water reach the ground to count as measurable precipitation at a location? If yes, that counts toward the PoP odds.
If you want another NOAA/NWS explanation of PoP, here’s the NWS FAQ page: NWS FAQ on PoP.
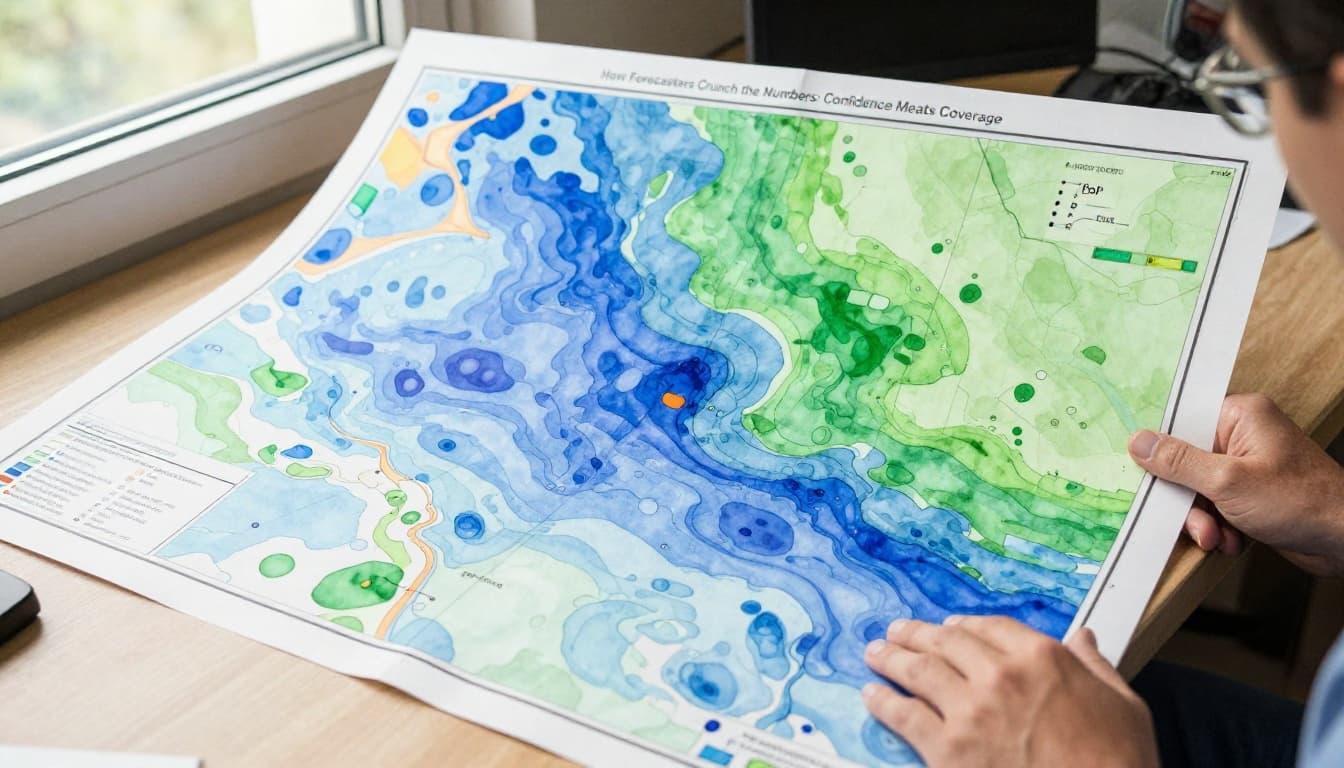
How Forecasters Crunch the Numbers: Confidence Meets Coverage
Forecasters do not just guess a percent. They blend information from models, observations, and experience. Then they translate it into PoP.
A common way to explain the math is:
PoP = C × A
Where:
- C is the confidence (the chance precipitation happens in the forecast area)
- A is the percentage of the area expected to get measurable precipitation
So if confidence is high but coverage is limited, PoP drops. If coverage is wide but confidence is low, PoP also drops. Either way, PoP becomes the combined odds that measurable rain reaches your point.
This also helps explain why PoP can change even when the sky looks similar. Slight shifts in storm track and intensity can change either confidence or coverage.
Step-by-Step Examples That Make Sense
Let’s walk through the same idea with simple numbers.
First scenario:
- C = 80% confidence
- A = 50% coverage
So PoP = 0.80 × 0.50 = 0.40, or 40%.
Second scenario:
- C = 60% confidence
- A = 70% coverage
So PoP = 0.60 × 0.70 = 0.42. Many forecasts round that kind of value, so you might see 40%.
Now connect it to the time window. If your app says “Tuesday afternoon: 40%,” it’s not random. It’s an estimate for that specific period, based on how likely a storm setup is to deliver measurable rain to points in the forecast zone.
Also, PoP is meant to be calibrated. In plain terms, a “40%” PoP should line up with outcomes over many similar forecasts. You won’t see it on one day. But over a long run, it should behave consistently.
Busting Myths: It’s Not What You Think
Most forecast confusion comes from people treating PoP like something it isn’t. The result is frustration, and sometimes bad planning.
PoP sounds like it should map to what you see in the sky. But forecasts are probabilities, not promises. Also, the percent refers to measurable precipitation at a point, not “your whole day” or “your whole town.”
Here are the big myths.
Myth 1: Rain Covers That Percent of Your Town
When you see 30% chance of rain, you might picture 30% of your town soaked. That’s not how PoP works.
PoP is closer to: “At your location, how likely is measurable precipitation to hit during the forecast time window?” The percent does not describe an exact area that gets rain at once.
And even if confidence and coverage are high, storms can still shift. Local variation is real. That’s why two neighbors can have opposite outcomes during the same hour.
Also, NWS uses detailed forecast terminology that can affect what you see alongside PoP. For example, forecast guides explain how precipitation probability links with sky conditions. Here’s a useful NWS service guide: NWS forecast terminology guide.
Myth 2: Expect Rain for That Fraction of the Day
Another common mistake: “40% means 40% of the hours will be rainy.” That sounds logical, but it’s not PoP’s job.
PoP counts whether measurable rain happens during the period. It does not track duration like “2.4 hours of rain out of 6.”
So a 60% chance could mean:
- One strong shower that soaks the ground fast
- Light drizzle that drags on, if it stays close
- A dry outcome at your point, because the storm misses by a little
In other words, PoP is about hit or miss for measurable precipitation, not time spent raining.
A “chance of rain” forecast is a point probability for measurable precipitation, not a rain-timer.
Decoding Percentages: What 10%, 50%, or 100% Tells Your Plans
Percentages can help your planning, as long as you interpret them right.
Use this mental model:
A 10% PoP suggests that in about 1 out of 10 similar forecast situations, measurable rain reaches points in the forecast area.
A 50% PoP suggests about 5 out of 10.
A 100% PoP means measurable precipitation at your point during that period is very likely.
In everyday terms, this is how it often feels:
- 10% to 20%: possible, but most plans work out dry
- 30% to 40%: enough risk to plan for a quick change
- 50% to 70%: pack gear if you can, or choose a backup plan
- 80% to 100%: assume rain will happen near you
The key word is near. PoP still allows variability.
Low Odds (Under 30%): Safe to Skip the Umbrella?
Under 30% usually means your odds of staying dry are better than your odds of getting measurable rain.
Still, don’t treat 20% like “0%.” If you’re planning something you hate to interrupt, bring a small umbrella or a rain jacket. The cost is low. The benefit is big.
A few practical examples:
- 20% chance for a BBQ often means you can probably go without heavy prep
- 25% chance for an outdoor wedding might mean a light coat is smart
- 10% chance is often a “go for it” number for quick plans
Also, keep an eye on how the forecast changes later. PoP can trend up or down as models update.
Medium Odds (30% to 70%): Pack Gear Just in Case
When PoP lands between 30% and 70%, your plan depends on your rain tolerance.
Think of it like this: you’re choosing between two outcomes. One is a dry win. The other is a wet, fast switch.
A 40% PoP can still soak you, because “measurable rain” might happen in a short burst. Meanwhile, a 60% PoP might bring steady rain, or it might bring scattered hits that still ruin your plans.
Here’s a helpful way to decide:
- If rain ruins your event, bring backup gear (or move indoors).
- If rain is annoying but not damaging, bring a light rain layer.
- If you have flexibility, wait for the next forecast update window.
Also, when the forecast moves from PoP to rainfall amounts, the details matter. If you’re planning around heavier rain, probabilistic rainfall products use PoP ideas to estimate odds of certain rain totals. The WPC product guide covers this style of probabilistic rainfall forecasting here: WPC PQPF guidance.
Chance of Rain vs. “Likely” or “Showers”: Spot the Differences
Different words can mean similar things, but they’re not always shown the same way.
Here’s a quick comparison of how people commonly mix these up:
| Forecast phrase | What it usually signals |
|---|---|
| Chance of rain | A specific PoP percent for measurable precip at your point |
| Likely | Usually implies a high chance, often in the 60% to 70% range (wording varies) |
| Showers | A type of precip, but the chance can still be PoP-based |
Apps also vary in what they show. Some include “trace” events more readily. Others focus on measurable amounts. That difference can make one site look more pessimistic than another, even when both follow the same core PoP idea.
In the US, NWS-based forecasts tend to stay consistent with the PoP definition. So if you want fewer surprises, use NWS for your baseline and cross-check with local radar updates once the time gets closer.
Conclusion: The Real Meaning Behind “Chance of Rain”
That picnic “30% chance” wasn’t random luck. It was PoP, the chance measurable rain reaches your forecast spot in the stated time window. It does not mean your town gets rain, and it does not mean it rains for that fraction of the day.
If you remember one thing, make it this: percentages are point odds, not time promises. Then you can plan smarter, with less stress.
Next time your forecast shows a chance of rain, check your exact location, watch trends as updates roll in, and use radar when the storm is near. What’s your most memorable forecast fail from a “small chance” day? Share it in the comments.