
A picnic can go sideways fast. Someone brings light drinks, checks the forecast, and assumes “mild” means comfy. Then the air feels heavier than expected, and they feel worn out before dessert.
You can avoid that kind of surprise. Temperature data tells you how warm or cold it is. Humidity levels tell you how wet the air feels. Wind speed tells you how fast conditions change on your skin. Put together, they explain why 80°F can feel harsh some afternoons, or why a “not that cold” day can still feel painful in the wind.
These numbers also matter for daily safety. Heat stress can sneak up when humidity blocks your sweat from cooling you. Frostbite risk rises when wind steals heat from exposed skin. And for planning, the “feels-like” part often matters more than the raw reading.
In the sections ahead, you’ll learn what each metric means, how to compare it with comfort ranges, and how wind and humidity team up with temperature. You’ll also get practical tips for reading apps and weather stations without common mix-ups.
What Temperature Readings Tell You About Hot and Cold Days
Temperature is the starting point. It shows air warmth using a scale like Fahrenheit (°F) in the US, or Celsius (°C) in much of the world.
Think of temperature like an oven setting. It tells you the heat level, but it doesn’t tell you how fast heat hits your skin. That’s where humidity and wind come in.
Here’s a quick way to translate temperature into feelings and habits:
| Temperature | Common feel | What to plan |
|---|---|---|
| 68°F to 78°F | Cozy to comfortable | Light layers, normal outdoor time |
| 50°F to 68°F | Cool, you may notice breeze | Bring a jacket if you’ll stay out |
| 32°F to 50°F | Cold, exposure bites | Hat, gloves for long walks |
| Below 32°F | Freeze risk | Avoid lingering outside, watch icy spots |
When temperatures swing high or low, the risks change. In heat, your body works harder to cool itself. In cold, your body burns energy to stay warm. Both can affect sleep, focus, and safety on trails, roads, and job sites.
Also, extreme numbers matter even if you feel “fine” at first. Your body needs time to react. If you’re outside for hours, plan for what happens later, not just what you notice right now.
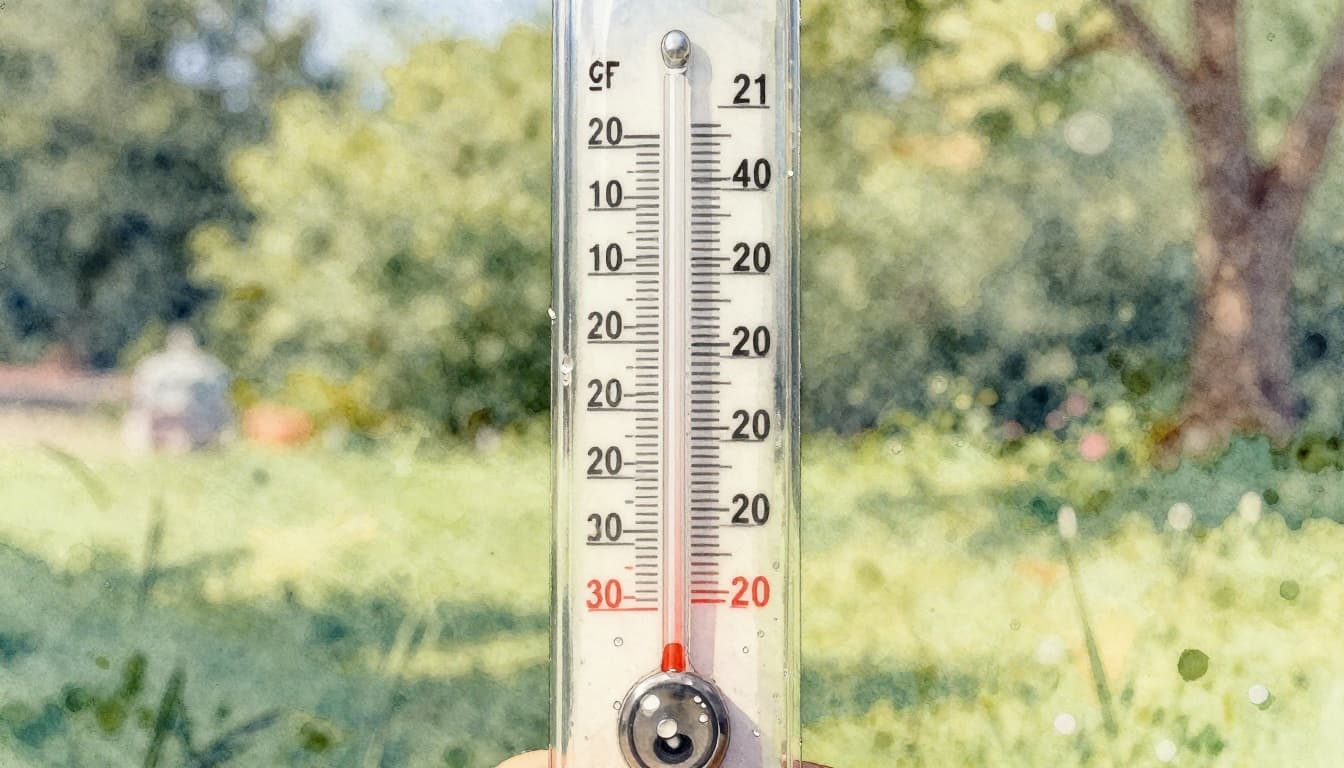
Fahrenheit Versus Celsius: Quick Conversion Guide
If your forecast uses unfamiliar units, it can mess up your whole plan. Here are the most common reference points, plus a fast method.
Freezing and boiling checkpoints
- 32°F = 0°C (water freezes)
- 212°F = 100°C (water boils)
The conversion formula (US to metric)
- (°F − 32) × 5/9 = °C
If you want a simple calculator you can keep handy, use a Fahrenheit to Celsius conversion guide.
A couple examples:
- A 90°F beach day is about 32°C
- A 0°C snow day is about 32°F
Why this matters: people often misread the “feels-like” warning because the unit switch happens in their head. To avoid that, check your phone settings. Many weather apps let you switch units in seconds.
Comfort Zones and Danger Zones for Daily Life
Most people feel best in a middle range. As a general guide:
- 60°F to 80°F often feels “right” for walking, biking, and casual sports.
- Below 50°F usually means you’ll want layers, especially with wind.
- Above 85°F can strain you faster, especially outdoors for long stretches.
Then there are danger zones where time and exposure matter.
- Near or below 32°F, surfaces can ice over. Watch for slip risk.
- Around or above 90°F, fatigue and heat stress risks rise, even if you’re moving slowly.
Here’s the key trick: don’t treat temperature like a single-person experience. Your clothing, activity level, and time outdoors all change your risk.
For example, hiking can feel “fine” at 75°F at first. But if humidity is high and you’re sweating, you can hit trouble sooner. The next sections show how humidity changes that story.
Why Humidity Feels Sticky and How Dew Point Reveals the Truth
Humidity explains the “sticky” part of weather. It affects sweat, comfort, and how your body cools down.
A lot of people look at relative humidity (RH) first. That number compares how much moisture is in the air to the maximum moisture the air could hold at that temperature. It sounds simple, but it can mislead you.
Why? Because RH stays percent-based. The air can show a “high percent” even when the total moisture is not that high.
That’s why forecasters also use dew point. Dew point is more direct. It tells you the moisture level in a way that links to how your skin feels and how sweat cools.
Ever wonder why 80°F feels fine one day and miserable the next? Humidity and dew point usually explain that gap.
Relative Humidity Explained Without the Confusion
Relative humidity is a percent. It answers this question: “How close is the air to being fully saturated at this temperature?”
Here’s the common confusion:
- 50% RH at 90°F can feel wetter than 50% RH at 50°F
- Cold air holds less moisture, even if the RH percent looks “high”
A simple analogy helps. Imagine air as a sponge.
- At higher temperatures, the sponge can hold more water.
- So 50% at 90°F means the sponge is still pretty full.
- At 50°F, 50% means less total water in the sponge.
Also, high RH doesn’t always mean rain. It can mean “muggy air,” even when skies stay mostly dry.
If you want a deeper comparison grounded in plain explanations, check dew point vs humidity from the National Weather Service.
Dew Point: Your Best Friend for Real Comfort Levels
Dew point is the temperature where moisture in the air would start forming dew. In other words, it’s a strong clue for how damp the air is.
As a practical guide:
- Below 50°F: usually feels comfortably dry
- 60°F to 65°F: “sticky” comfort zone
- Above 70°F: often feels miserable and exhausting
- Rising fast: your comfort drops as the day goes on
| Dew point | Typical feel | What to expect |
|---|---|---|
| < 50°F | Dry to comfy | Sweat evaporates more easily |
| 50°F to 60°F | Mildly humid | Light stickiness, still okay for most plans |
| 60°F to 65°F | Sticky | Workouts feel harder, breaks feel necessary |
| > 70°F | Very humid | Higher heat stress risk, slower cooling |
A useful habit: compare dew point to the air temperature. When the gap is small, the air feels heavier. When the gap is larger, it feels drier.
In fall and early winter, dew point also explains why “cool” days can still feel damp. Your skin feels that moisture, even when the thermometer looks mild.

Breaking Down Wind Speed Direction and Gusts for Smarter Choices
Wind affects how fast heat moves away from you. In cold, it steals warmth from skin. In heat, it can help sweat evaporate and cool you down.
Wind also comes in two types of numbers:
- Sustained wind (the usual wind level)
- Gusts (brief spikes that can surprise you)
Direction matters too. If you’re sensitive to smoke, a “north wind” can mean different exposure than a “south wind,” depending on where that air came from.
And yes, wind units can trip you up. So let’s fix that next.
Wind Units and Direction: From Knots to Compass Points
First, speed units:
- US forecasts often show mph
- aviation and some marine reports show knots
- 1 knot = 1.15 mph
Then, direction:
- A north wind blows from the north.
- That’s different from “a wind toward the north.”
Finally, sustained vs gusts:
- Sustained wind is the steady average.
- Gusts are sudden jumps, often 10 mph higher (or more).
- Gusts matter for balance, umbrellas, bikes, and branches.
If an app shows wind arrows, treat the arrow like a “source hint.” The arrow usually points in the direction the wind is blowing, but the text label tells you where it comes from. When in doubt, read both.
Beaufort Scale: What Wind Feels Like on Land and Sea
The Beaufort scale converts wind strength into a feel you can picture. It’s not exact, but it helps you plan.
Here are a few common points:
| Beaufort force | Land feel | Rough wind strength |
|---|---|---|
| 0 to 1 | Calm, still air | very light or no movement |
| 3 (gentle breeze) | Leaves rustle, noticeable motion | moderate |
| 8 (gale) | You struggle to walk straight | strong, risky |
For more context, see the Beaufort wind scale explained by the Royal Meteorological Society.

How Temperature Humidity and Wind Team Up for Feels-Like Temps
Here’s the big idea: your body doesn’t live on one number. It responds to the combo.
- Hot + humid often creates a big heat stress risk. Sweat can’t cool you fast enough.
- Cold + windy creates wind chill. Wind speeds up heat loss from skin.
- Wind + heat can help you feel better by moving air.
- High dew point + warmth often means comfort drops and storms become more likely.
If an app shows feels-like temperature, treat it as your real guide. It already includes wind and moisture effects.
Still, it helps to know the “why.”
Wind Chill: Why Windy Cold Days Bite Harder
Wind chill shows what cold feels like to exposed skin. It depends on air temperature and wind speed.
A useful way to think about it: your clothes insulate you, but wind keeps pushing warm air away. That’s why cheeks and hands feel colder than you expect.
For outdoor safety, pay attention when:
- wind is steady and you’ll be exposed for long periods
- temps hover near freezing
- you plan to stay active (sweat can freeze on your skin later)
If you want the official chart style lookup, use the National Weather Service wind chill chart (PDF).
Wind chill matters most for exposed skin, not for your jacket’s warmth alone.
Heat Index: Hot and Humid Equals Double Trouble
The heat index combines temperature and humidity. It predicts how hot it feels when moisture slows sweat cooling.
For example, a forecast like 90°F with 70% RH can feel closer to 105°F in real life. You may feel that shift within minutes.
Watch for heat index warning ranges on your local forecast. The National Weather Service keeps a clear lookup chart here: NOAA heat index chart (PDF).
Practical safety steps help:
- drink water before you feel thirsty
- take shade breaks, even if you feel “okay”
- reduce hard effort during the hottest hours
Also remember: humidity affects more than comfort. It affects how fast your body recovers after exertion.
Pro Tips for Reading Apps Stations and Avoiding Traps
Weather apps now do more than show a single number. Still, the “more data” can become “more confusion” if you read it wrong.
A smart order of operations often works best:
- check temperature for clothing
- check dew point for moisture comfort
- check wind and gusts for exposure risk
- then compare feels-like for your final plan
The latest app trends also show why this matters. In early 2026, severe weather events drove huge jumps in app downloads. For example, the “Emergency” weather app surged in rank and downloads during a winter storm week, showing how quickly people rely on alerts when conditions turn serious. At the same time, apps are improving with AI-based prediction updates and better alerts for frost and dew-related conditions.
Also, many apps include “feels” features. Compare those with your local knowledge. If you live in a windy area, trust gusts too.
Best Apps and Tools to Decode Weather Data Right Now
Apps can help you interpret temperature data, humidity levels, and wind speed without mental math.
Here are a few tools people commonly use for practical weather checks:
- WeatherBug for real-time updates and warnings
- AccuWeather for hourly detail and radar views
- The Weather Channel for “feels-like” planning
- WindAlert for a wind-and-weather map view (handy when gusts matter)
- Windy.com for strong visuals when you’re learning wind direction
As you test apps, use the same habit each time. Check dew point first, then look for gusty wind spikes. After that, compare the app’s feels-like number to what you expect from the air.
Fresh 2026 Updates and Mistakes Everyone Makes
Weather data tools keep changing. That’s a good thing, but it creates fresh mistakes.
Recent updates and improvements in apps often include better alert timing and AI help for forecasts. Still, many people still mess up the basics. Here are five common errors to fix:
- Mixing up units
Switching between °F and °C can lead to major planning errors. - Ignoring gusts
A calm-looking average wind can still mean sudden spikes that knock you off balance. - Trusting RH percent alone
A “high percent” at cool temps doesn’t always mean the air will feel as sticky. - Checking wind direction the wrong way
Always interpret “north wind” as “from the north.” - Skipping feels-like temperature
Raw temperature can hide the real comfort or safety risk.
If you want one quick rule for daily planning, use this: dew point for humidity, gusts for wind exposure, and feels-like for safety.
That approach keeps you grounded, even when forecasts change hour by hour.
Conclusion
Temperature, humidity, and wind data can look like separate facts, but your body experiences them as one story. When you understand the combo, you stop guessing and start planning.
Start with dew point for comfort, and use feels-like temperature for real safety. Then treat gusts as the part that can surprise you, even on mild days.
Next time you check the forecast, pick one thing to focus on first. Then ask yourself, “Does this match how I expect it to feel?” If you’re curious, share a quick weather story from your area in the comments.