
Have you ever checked the weather app for a picnic and wondered how forecasters can know about storms hours away? Weather can change fast, especially once you look above the ground. That’s where weather balloons predict weather by giving meteorologists a clear view of the air high overhead.
A weather balloon carries a small instrument package called a radiosonde. As it climbs, it measures temperature, humidity, air pressure, and wind speed and direction. In other words, you get a real-time “snapshot” of the atmosphere from near the surface all the way up to about 20 to 25 miles high.
Then the balloon sends that data to ground stations, and meteorologists feed it into computer models. Because satellites and radar can’t see every layer of the sky perfectly, these direct measurements help fill in the missing pieces, improving forecasts for things like storms, tornado risk, and aviation weather.
Next, you’ll see how these balloons actually work, from launch to data collection, and why the readings matter so much.
What Exactly Are Weather Balloons and How Do They Fly?
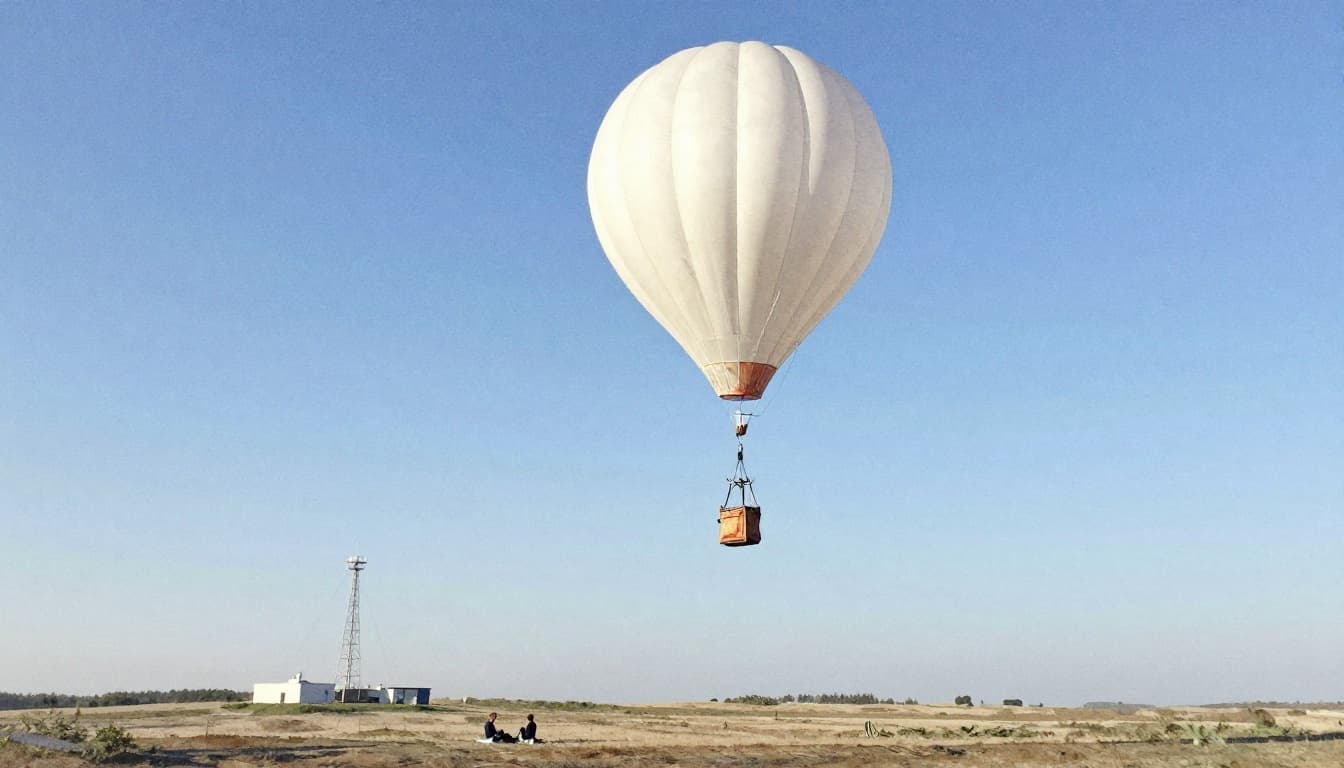
Ever wonder what’s up there above the clouds, where weather apps can’t see? Weather balloons are large helium-filled latex balloons that carry a small sensor package called a radiosonde. As they rise, the radiosonde acts like a floating probe, measuring how the air changes from the ground upward.
They travel fast, too. After about 1 to 2 hours, the balloon bursts at high altitude, and the radiosonde continues its data run while it falls back with a parachute. Then winds take over again, carrying the balloon’s remains and the radiosonde path far from the launch site.
These flights are timed for regular updates, often twice a day. That steady schedule helps forecasters spot patterns early, especially when storms start forming.
The Radiosonde: Heart of the Balloon’s Data Collection
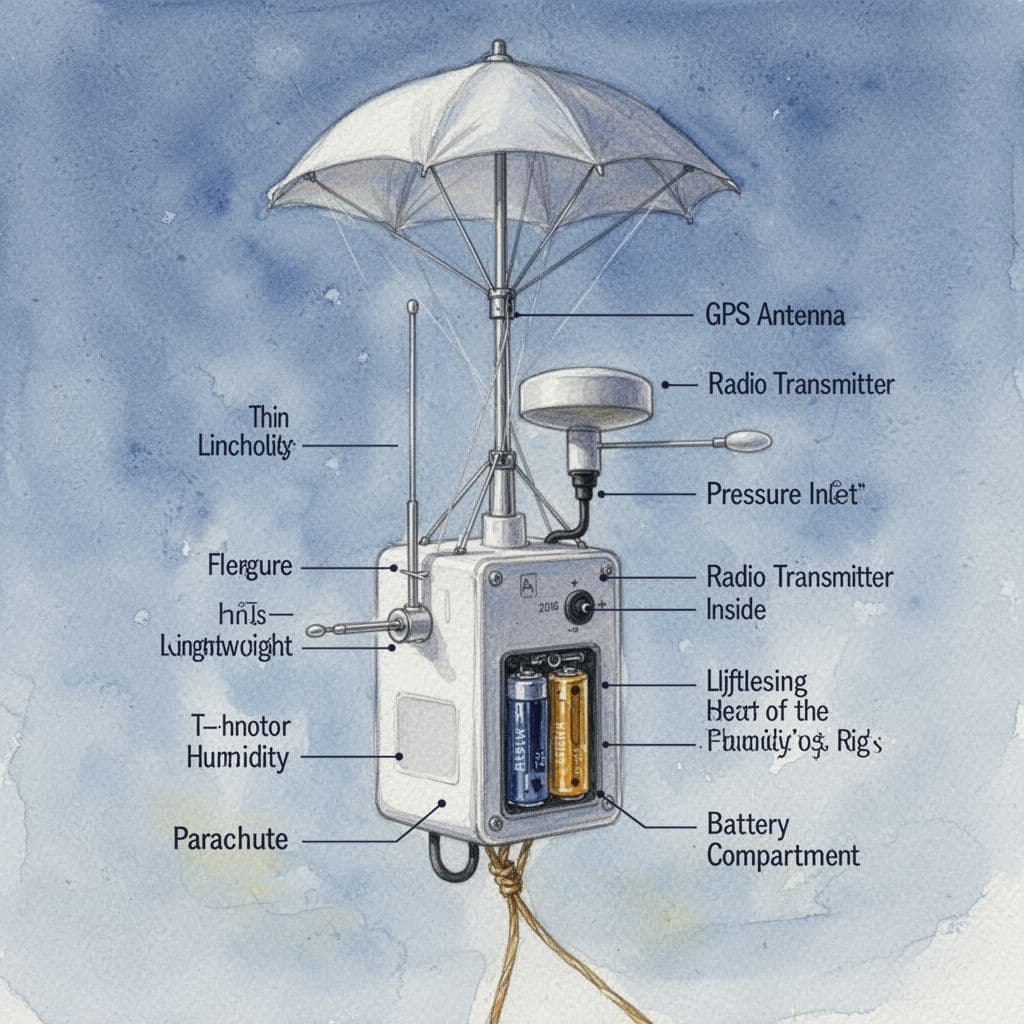
A radiosonde is a lightweight box packed with sensors and a radio transmitter. Think of it like a “tiny weather lab” on a string, dipping through the atmosphere’s layers and reporting back each step of the way.
Here’s what it measures:
- Temperature (wire probe): a thin sensor responds as air cools or warms with height.
- Pressure: the instrument tracks how air pressure drops, which helps convert height and air conditions.
- Humidity (horizontal probe): it estimates how much moisture is in the air at that level.
- Wind (GPS/radar tracking): GPS motion tells the balloon’s speed and direction while it climbs.
Once it’s in the air, the radiosonde sends readings in real time to nearby receiving stations. Those stations then pass the data along for plotting and forecasting work.
You’ll often see the results turned into a Skew-T diagram, a chart that shows temperature and dew point with height. That helps meteorologists spot stability, moisture depth, and wind shear in one quick look.
To learn how these radiosondes work, NOAA’s overview is a solid reference: Radiosondes from NOAA.
Step-by-Step Journey from Launch to Burst
A weather balloon flight looks simple, but every step matters. First, crews inflate a helium balloon and attach the radiosonde package to the line. Then they check the sensors and radio link so the data starts clean.
Next comes the launch timing. In the US, flights usually run twice daily, often near morning and evening conditions. During stormy weather, launches may happen more often, since the atmosphere changes quickly.
Once the balloon lifts off, it climbs at a steady pace. As it rises, the radiosonde keeps transmitting temperature, humidity, pressure, and wind data. Ground stations receive the signal and pass the information along for analysis.
After roughly 90 minutes (sometimes a bit more), the balloon reaches a point where it can’t stretch anymore. Then it pops. The radiosonde and its parachute stay on the mission a little longer as they descend, still sending measurements.
Meanwhile, the whole system drifts with the winds, so forecasters can follow the path using GPS and station tracking. In the end, the descending radiosonde is designed to survive the fall long enough for recovery and reuse when possible.
The Vital Data Weather Balloons Gather from the Sky
Weather apps show what’s happening near the ground. Radiosondes go higher, so you can see the “setup” for weather before it reaches you. The balloon tracks four main things as it climbs, and each one tells a different part of the story.
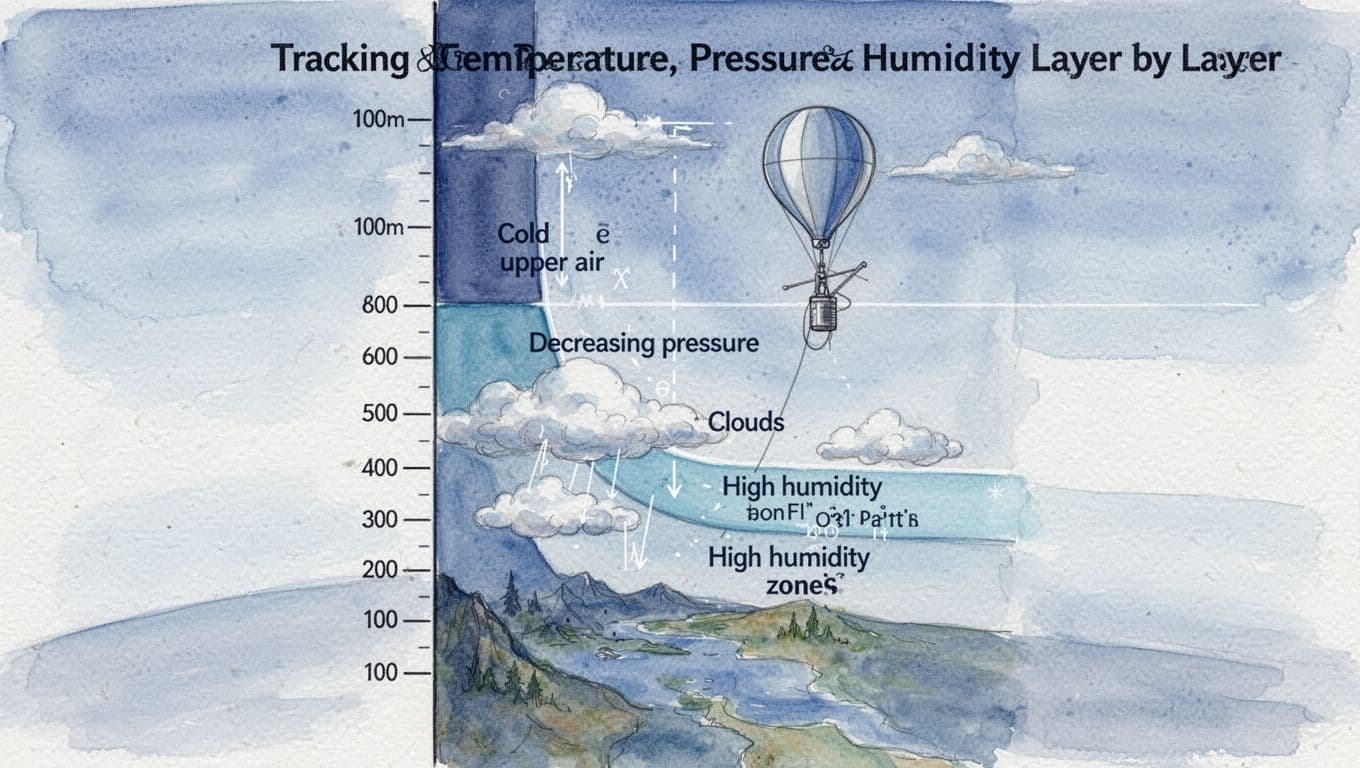
Tracking Temperature, Pressure, and Humidity Layer by Layer
As the radiosonde rises, sensors watch the atmosphere change with altitude. Temperature tells you where air is cold enough to form or strengthen clouds. For example, a sudden cool layer above a warmer layer can hint at an inversion, which often traps fog or low stratus.
Then comes pressure. With height, air pressure drops fast. This helps meteorologists convert position into vertical structure. When pressure falls in the right way, it supports ideas about rising air, and that matters for storms that grow upward.
Next is humidity and its moisture estimate, often linked to dew point and cloud formation. High humidity in the lower layers can explain why you get mist and wet ground mornings. Higher humidity aloft often lines up with clouds that can thicken into rain or snow.
Think of it like looking at a body from head to toe. Temperature changes at different depths tell you what’s going on inside, not just at the surface. In the same way, vertical profiles reveal where moisture and cooling line up, which improves short-term prediction without waiting for clouds to fully form. NOAA describes how these upper-air soundings support forecasting in their radiosonde materials on NOAA radiosondes.
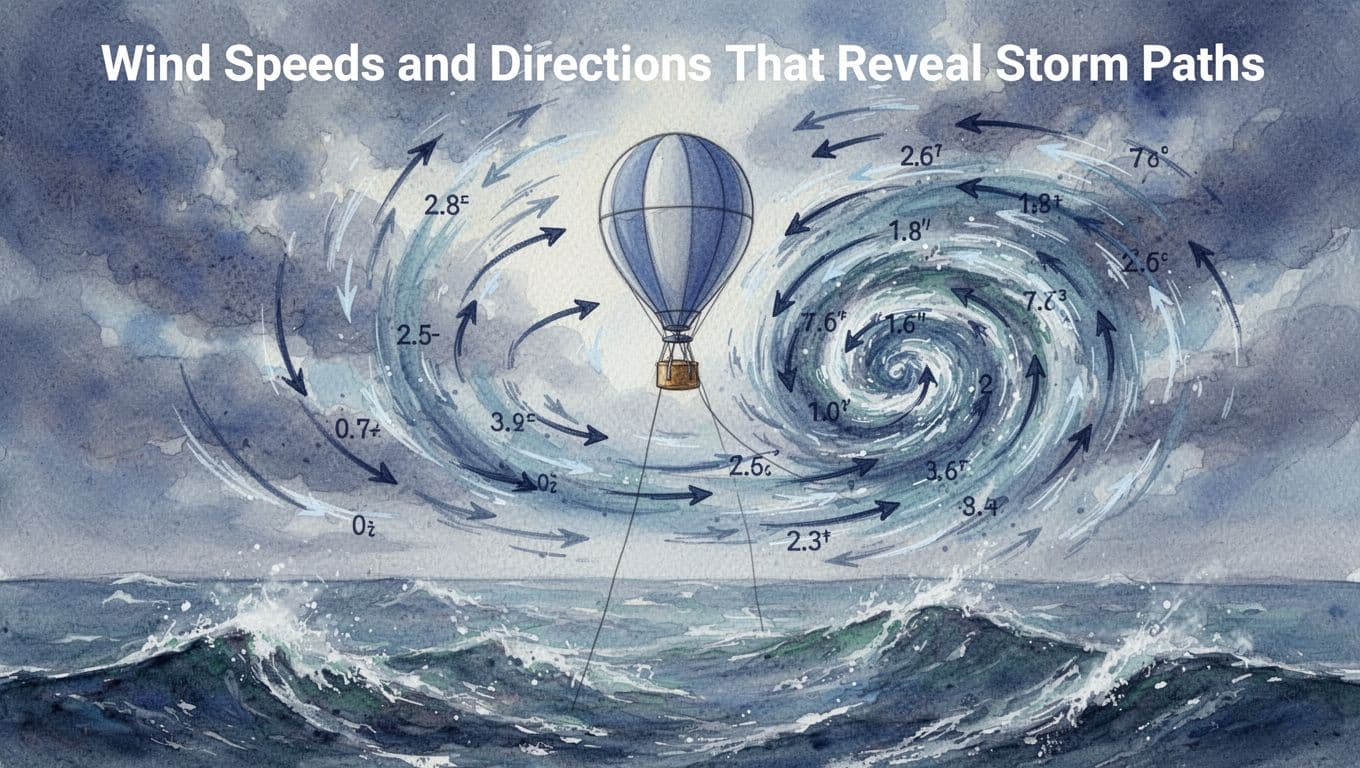
Wind Speeds and Directions That Reveal Storm Paths
Temperature and moisture set the stage. Wind profiles tell you how storms move and how they may intensify. As the radiosonde climbs, GPS helps calculate wind speed and direction at each height.
This matters because strong winds higher up can steer storm clouds, much like ocean currents push a boat. If that wind turns with height, it can also affect storm rotation. Meteorologists watch for patterns that support dangerous development, including tornado-favorable wind fields and hurricane steering currents.
Surface winds tell you what you feel outside. Upper-air winds often tell you where storms actually go. For aviation, that difference matters too, because turbulence and weather hazards often sit in layers you do not see from the ground.
In short, radiosonde wind data gives forecasters the “path” and the “push” aloft, so forecasts match the atmosphere above, not just the street-level conditions. For historical and ongoing access to these observations worldwide, the Integrated Global Radiosonde Archive (IGRA) is one key reference point.
How Balloon Data Turns into Spot-On Weather Predictions
Once the radiosonde data comes in, the real work starts. Meteorologists do not just “look at the sky,” they plug that vertical profile of temperature, moisture, and winds into forecast models so the computer begins closer to what the atmosphere is actually doing.
Think of it like driving with a GPS. Your model can still estimate the route without updates, but when balloon data lands, the system corrects the “starting point,” and that matters most as storms grow.
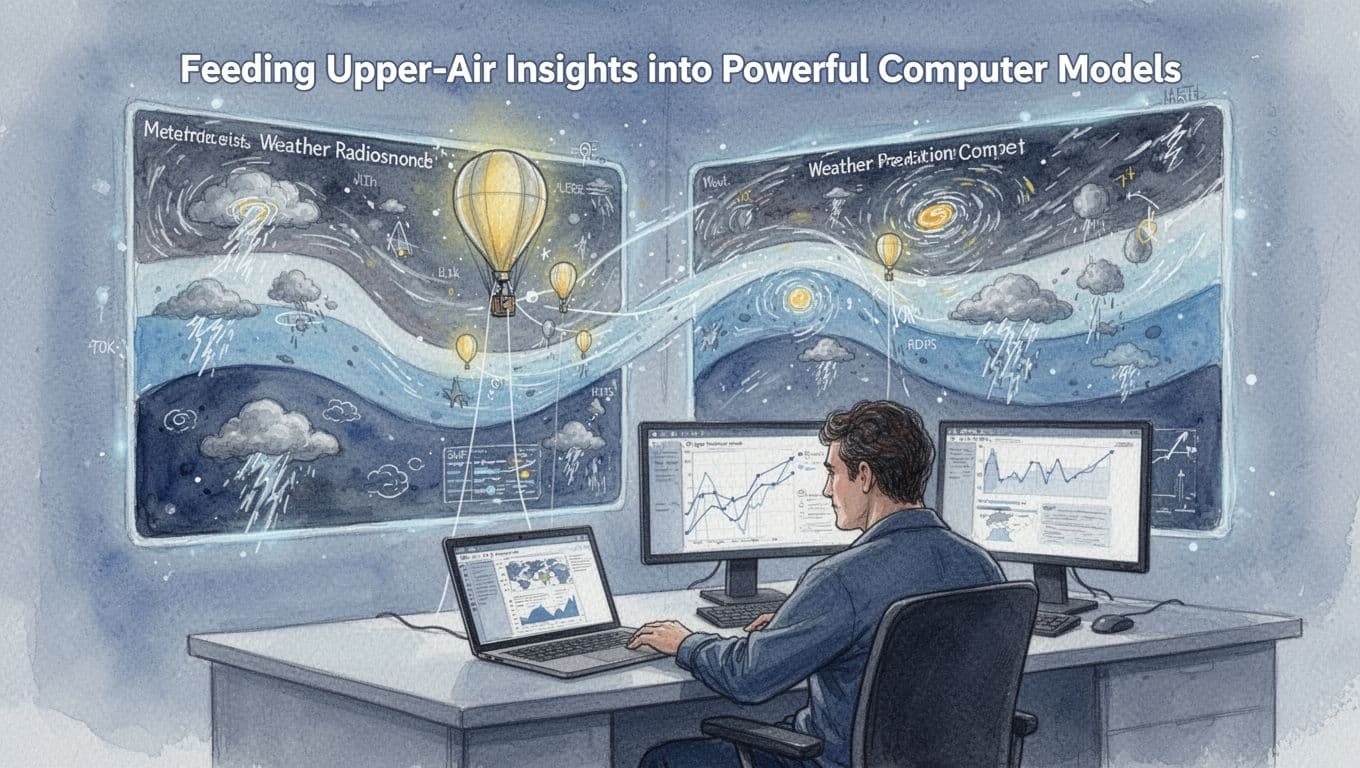
Feeding Upper-Air Insights into Powerful Computer Models
Balloon data becomes forecast-ready through data assimilation. In simple terms, the model does not start from guesses. Instead, it takes the raw radiosonde measurements and adjusts its internal state to match what the atmosphere reported.
That adjustment matters because the sky has layers. Near the ground, conditions might look calm, but aloft, winds and moisture can set off the chemistry of storms. Radiosondes measure those layers directly, which helps models know where the atmosphere is likely to rise, cool, and organize. NOAA explains how radiosondes provide those upper-air observations that support forecasting, not just observation.
Next, models run through forecast cycles. Each cycle uses balloon data plus other observations, like satellites and radar, to refine the “initial conditions.” As a result, forecasts typically improve through the common day-ahead to short-range window, including 24 to 72 hours out, when storm timing and intensity can still shift.
You can see why this is so helpful when you consider snow, hail, tornado potential, and hurricane guidance all depend on the same basic building blocks: temperature profiles, moisture depth, and wind patterns.
For a deeper look at the systems behind these updates, check NOAA’s overview of NCEP data assimilation.
Spotting Severe Weather Risks Others Miss
Some severe weather signals hide in the upper atmosphere. A surface report might show heat and a few clouds, yet tornado risk often hinges on wind changes with height. Balloon observations help spot those invisible ingredients early.
For tornadoes, meteorologists pay attention to how winds turn and strengthen with altitude. When winds align in tornado-friendly ways, that can support rotation as storms mature. Radiosonde wind profiles also help confirm whether the environment supports organized thunderstorms, not just scattered storms.
For hurricanes, the big question is track and steering. Upper-level wind patterns guide storms, so balloon data helps models place the “rails” hurricanes ride. When those rails are off, forecasts can drift, especially in the first day after landfall or rapid changes.
In winter weather, balloon data helps sort the vertical temperature structure. A cold layer near the surface can support snow, but a warm layer aloft can flip storms to rain or mix. That matters for school decisions, road crews, and emergency managers planning overtime.
If you want a real-world view of how balloon data gets gathered, see the National Weather Service radiosonde and weather balloon collection.
The Worldwide Balloon Network and Its Evolution
Weather forecasting does not rely on one magic instrument. Instead, it depends on a steady rhythm of observations, and weather balloons are a big part of that rhythm. Across the globe, radiosondes rise each day, sending a vertical “profile” of the atmosphere back to Earth. That regular coverage helps fill gaps between satellites and radar, especially over regions where those tools struggle.
In the next sections, you’ll see how the network spreads worldwide, and how it grew from simple pilot balloons into today’s GPS-equipped radiosondes.
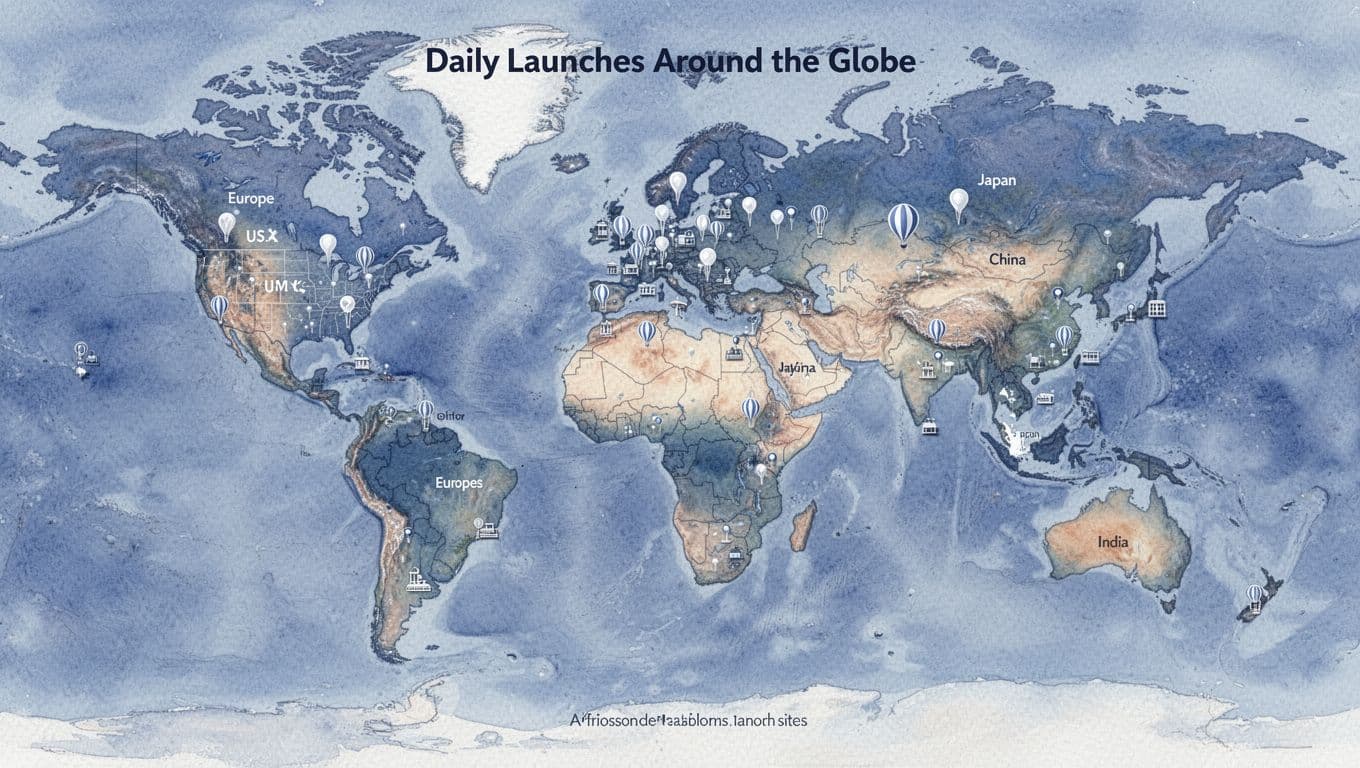
Daily Launches Around the Globe
The balloon network runs on a practical schedule. Most radiosonde sites launch twice daily, typically around 00Z and 12Z UTC. So, while you sleep or go to work, thousands of radiosondes keep climbing through the air layers that shape clouds, rain, snow, and storms.
The coverage is broad. You’ll find launches in the United States, across Europe, and throughout parts of Asia. In total, active reporting often falls in the 900 to 1,300 site range worldwide, depending on funding and logistics. Many countries also coordinate with international systems that help keep observations consistent.
Here’s what this looks like in real life. Normal days follow the routine. Then, when big weather events arrive, the network often ramps up with extra launches, short-notice missions, and special balloon flights. That can mean more data before a storm’s main burst, which helps forecasters adjust faster.
You can even track modern launch activity through databases such as Radiosonde tracker databases, which helps show how widespread the launch footprint really is.
From 19th Century Starts to Modern Must-Haves
The story of weather balloons starts with a simple idea: if you can lift sensors into the sky, you can learn what the atmosphere is doing. In the 1800s, people used pilot balloons to track wind aloft, often by sight. Observers could estimate wind changes by watching how the balloon moved. It wasn’t perfect, but it proved the concept.
Then, in the early 1900s, radiosondes changed everything. Instead of relying only on visual tracking, the instrument began sending data by radio. As radiosondes improved through the century, they became able to measure multiple variables at once, not just wind. Over time, the system shifted from manual, labor-heavy methods to routine launches built into national weather services.
Today, balloon measurements still matter because they give something satellites and radar often can’t provide as directly. You get a clean, layered view of temperature, humidity, pressure, and winds with height. That’s a direct feed for forecast models, especially when storms grow quickly.
In the U.S., the National Weather Service has used radiosonde-style upper-air observing for decades, building on roots from the Weather Bureau era. You can trace that history through resources like NWS history of upper-air observations. Even now, the core mission stays the same, and the network design keeps pushing reliability forward.
Still, how the radiosonde “flies” keeps improving. Modern setups use GPS for position, and they tend to send data more often and with better accuracy. As a result, the system stays useful for day-to-day forecasts and special storm missions, year after year.
Conclusion: Weather Balloons Turn Sky Layers into Forecasts
Weather balloons help predict the weather because they collect real measurements through the vertical air layers, not just what’s happening at the surface. As the radiosonde climbs, it reports temperature, humidity, pressure, and wind, then those observations feed forecast models through data assimilation. That means the “starting point” for a forecast matches the atmosphere more closely, so storm timing and intensity are easier to pin down.
In addition, the global radiosonde network keeps upgrading and staying consistent over time. Even with satellites and radar, balloons fill in gaps where upper-air data is still hard to observe. As coverage improves and new radiosonde designs collect more information per flight, forecasters gain more detail in the hours when weather can change fastest.
Next time a storm watch hits, look at it differently. Weather balloons are doing quiet work above you, mapping the conditions that apps rely on to warn you.
What single weather pattern do you wish you could “see” before it reaches your area?