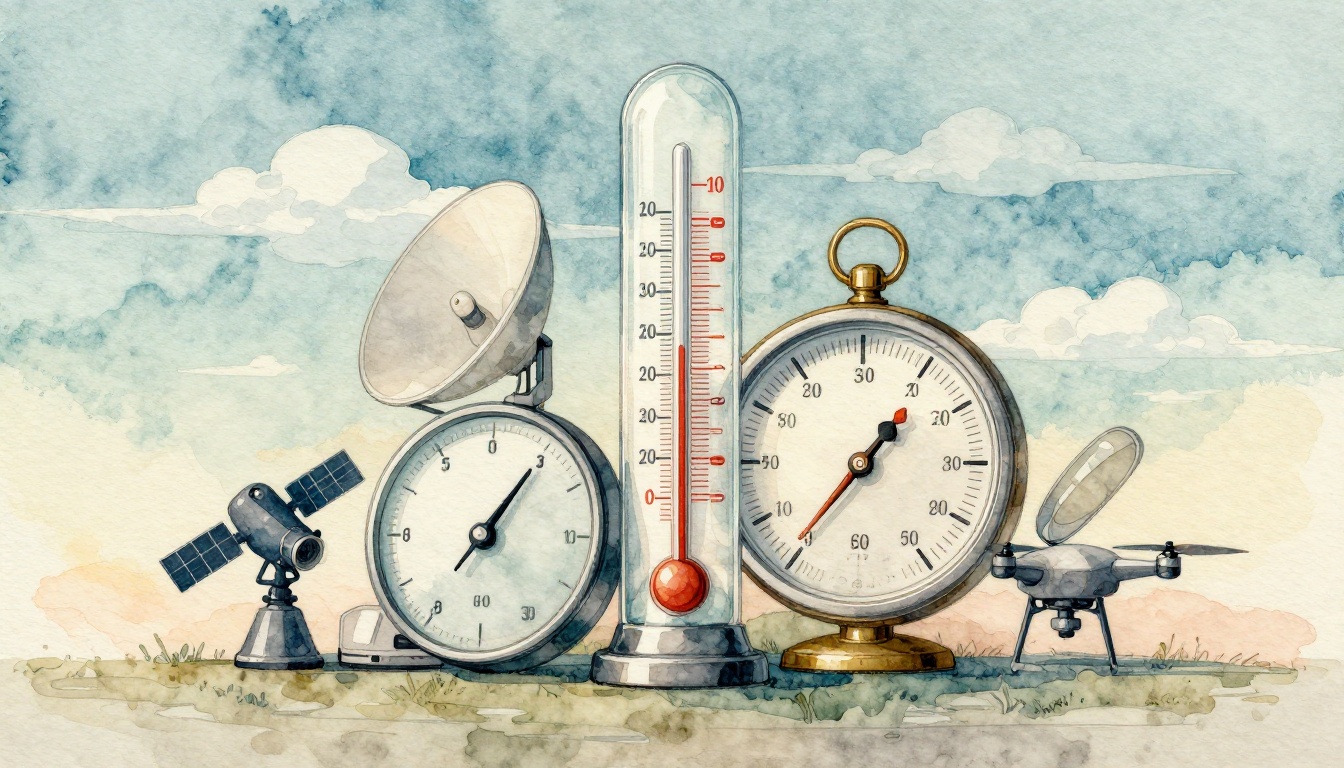
Ever planned a picnic and then watched the sky turn dark too fast? The weather can change in minutes, so tools used to measure weather conditions matter more than most people think. They help forecasters spot storms early, help pilots and first responders stay safe, and help farmers time planting and irrigation.
At a basic level, weather measurement starts with handheld instruments like thermometers, hygrometers, and barometers. From there, it scales up fast. Modern weather systems also use radar, satellites, and even drones to collect data across huge areas.
So how do all those tools turn raw readings into a forecast you can trust? Keep reading, and you’ll see what each instrument measures, how it works in plain language, and why it matters day to day.
Basic Tools for Measuring Temperature, Humidity, and Pressure
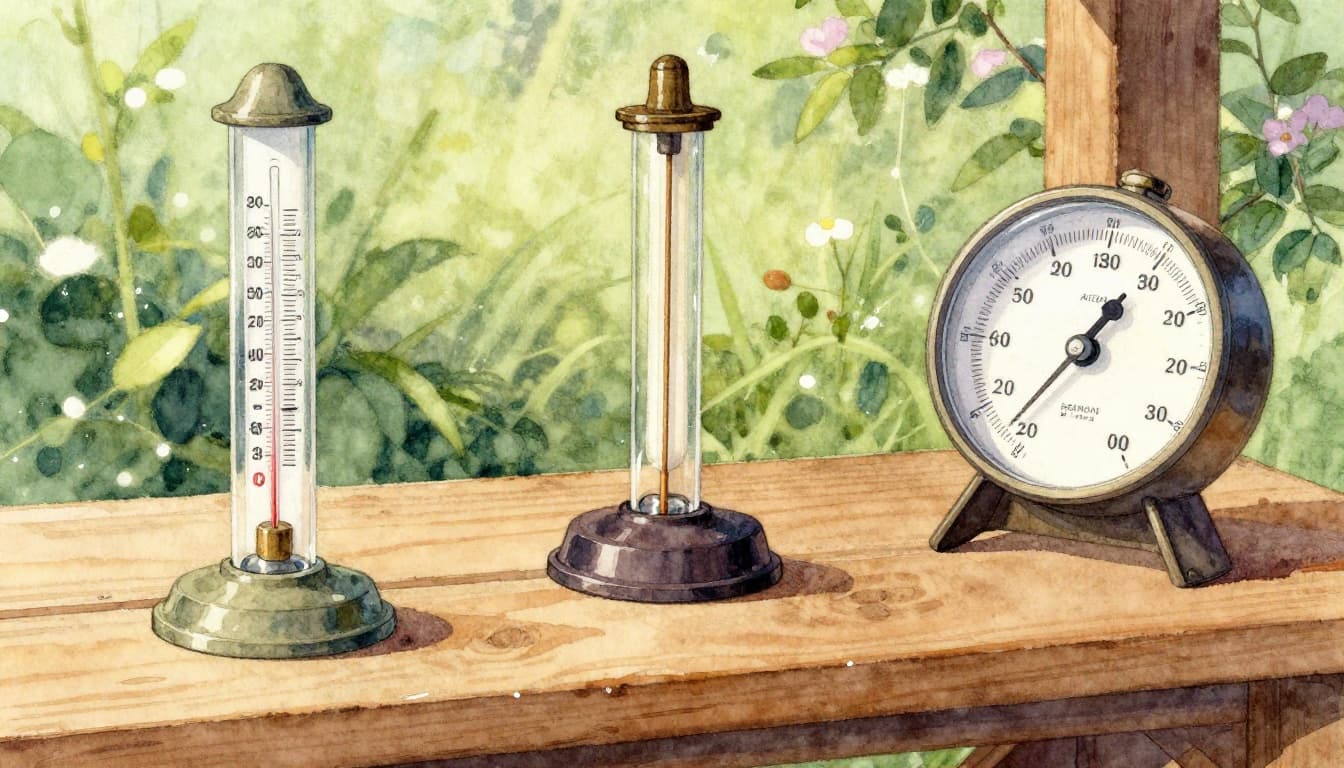
If weather is a story, temperature, humidity, and pressure are the plot twists. A single number can’t predict everything, but the pattern across time can. That’s why weather stations and meteorologists rely on repeatable tools that measure air conditions consistently.
For a broader look at the range of devices in use, check out common weather station instruments.
Thermometers: Capturing Air Temperature Changes
A thermometer measures air temperature, usually in Fahrenheit in the US. Classic models use a liquid that expands when it warms and shrinks when it cools. Old-school mercury thermometers work this way, but many newer units use alcohol too.
Digital thermometers use sensors instead of liquid. Many rely on electronic components that change their output as temperature changes.
Weather stations often place sensors in protective shields. That matters because direct sun can heat up the sensor and trick your reading. Then stations collect data continuously and often average it over time for updates.
Accurate temperature helps forecasting because temperature shapes everything else. It affects cloud formation, storm strength, and how fast a cold front can move.
Hygrometers: Sensing Moisture in the Air
Humidity tells you how much water vapor is in the air. You’ll feel it when a day turns sticky, or when the air feels dry and sharp.
Hygrometers come in a few common types:
- Hair hygrometers: A bundle of hair stretches and loosens as humidity changes.
- Capacitive (digital) sensors: They detect humidity based on how moisture affects electrical properties.
- Sling psychrometers: These use wet and dry bulbs. Evaporation cools the wet bulb, and the difference helps calculate relative humidity.
Because people experience humidity directly, hygrometer readings often explain comfort levels better than temperature alone.
Barometers: Detecting Pressure Shifts for Storm Warnings
Pressure is what you get when you measure the weight of the air above you. When pressure drops, the atmosphere often turns unstable.
Traditional barometers use mercury in a tube. The air pressure pushes against the mercury, and the height difference shows pressure changes. Other designs use aneroid capsules, which flex slightly as pressure changes.
Digital barometers use sensors that translate pressure changes into electronic readings.
In practice, a steady pressure trend suggests calmer weather. A falling trend often hints at clouds building, stronger winds, or a system moving in soon. That’s why barometer trends can support short-term planning, like deciding whether to take the grill out or wait.
Instruments Tracking Wind, Rain, and Visibility
Temperature and humidity set the stage. Wind, rain, and visibility decide how dangerous the scene gets. That’s why weather networks measure these factors with dedicated instruments that can handle fast changes.
These measurements also matter in different jobs. For aviation, wind direction and gusts shape takeoff decisions. For home owners, rainfall rates can predict flooding faster than a forecast headline.
Anemometers and Wind Vanes: Gauging Speed and Direction
Wind speed and direction rarely stay the same. So weather stations use instruments that track both.
Anemometers measure speed. A common design uses cups that spin faster as wind speeds up. Another type uses ultrasound, which can be useful in rough conditions because there are no spinning parts.
Wind vanes measure direction. A vane pivots so it points into the wind. When paired with an anemometer, you get a fuller picture: not only how fast the wind blows, but where it’s coming from.
For practical use at home, a wind vane plus anemometer can help you understand local patterns near your house. Still, remember that rooftop sensors can read differently than sensors farther from walls and trees.
Rain Gauges and Disdrometers: Quantifying Precipitation
Rain measurements go beyond “is it raining.” Meteorologists also care about intensity and the size of drops.
A basic rain gauge collects water in a funnel and measures how deep it is, often in millimeters or inches. More advanced tools include disdrometers, which estimate drop size and speed. These can use sensors like lasers or other methods to infer how precipitation behaves.
That data helps with warnings. For example, two storms can both produce 2 inches of rain, but one might dump it quickly and overwhelm drainage systems. Disdrometer data supports better radar interpretation and rainfall estimates.
If you want a simple home setup, a straight-sided rain gauge is a solid start. Place it away from overhangs so water from roofs doesn’t splash in and inflate readings.
Advanced Tech Like Radar, Satellites, and Drones for Wide-Area Monitoring
Basic instruments work best near where they’re placed. But storms move. That’s where wide-area tools step in. They “see” large regions and help fill gaps between stations.
This is also where measurement systems connect to forecasting models. For example, modern networks increasingly combine station observations with radar and satellite data. Some home stations also use newer sensor designs like sonic anemometers and specialized rain detection methods.
Weather Balloons and Radars: Probing Storms from Afar
Weather balloons use radiosondes to measure air conditions higher up. A sonde sends temperature, humidity, and pressure back while it rises. This helps forecasters understand the vertical structure of storms, not just what’s happening near the ground.
For an overview of upper-air sampling, see NOAA RRS program overview.
Radar takes a different approach. Doppler radar sends out pulses that bounce off rain and other targets. Then it estimates where precipitation is and how it’s moving. That’s one reason forecasters can warn about tornado potential, because storm motion shows up clearly in radar data.
Satellites and Drones: Eyes in the Sky and Targeted Flights
Satellites watch the entire planet, which means they’re ideal for tracking cloud cover and storm development. Many satellites also use infrared data. That helps identify cloud height and storm intensity even when it’s cloudy everywhere on the ground.
In the US and beyond, many systems keep working through the day and night. For example, COSMIC-2, NOAA’s satellite mission collects atmospheric data that supports weather forecasting and climate research.
Drones are different. They can gather data in the lower atmosphere where balloons might not reach fast enough. Some research and operational efforts explore drone flights to fill measurement gaps around storms. The key advantage is targeted sampling, especially when conditions are too risky or too hard for crews to measure directly.
How These Tools Team Up for Better Weather Predictions
No single tool solves the whole weather puzzle. Instead, tools used to measure weather conditions work like a team.
A surface station might report temperature and humidity. Radar can show the storm’s shape and motion. Satellites can track broader cloud patterns. Then forecasters combine it all into models that update as new data arrives.
This teamwork also explains why forecasts can improve over time. When networks grow denser, measurements catch more local changes. When sensors get better, data quality improves. And when systems add new methods, like better rain detection or wind sensing, forecasts can match what people experience outside.
Even at home, you benefit. Many weather apps pull from station networks and model outputs. Some also incorporate near-real-time station data to estimate rain timing.
If you want a practical next step, pick one tool and use it consistently, like checking a local station app or setting up a simple rain gauge. Then, compare what you measure with what the forecast predicted. You’ll start seeing how all these instruments connect to real life.
Conclusion
Weather measurement tools range from simple handheld instruments to advanced systems that monitor storms from space. Thermometers, hygrometers, and barometers track the air’s basic conditions. Wind sensors and rain gauges quantify what people feel and what can flood streets.
Meanwhile, radar, radiosondes, satellites, and drones extend those measurements across large areas. Together, they turn scattered readings into forecasts that support safety and planning.
The next time the sky changes fast, remember the chain of tools behind it. Then check your local station data and try one home measurement step, so the forecast stops feeling like a guess.